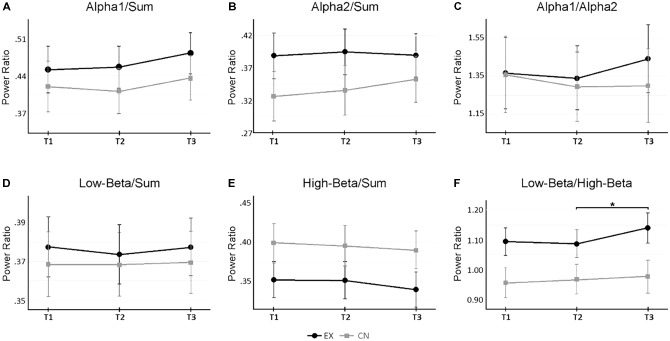
FIGURE 3.
Changes in sub-band power ratios across rest and virtual reality intervals. (A,B) Change in Alpha 1 and Alpha2 activity relative to total broadband power (‘Sum’) across measurement time points. (C) Relative power changes between Alpha 1 and Alpha2. (D,E) Change in Low- and High-Beta activity relative to total broadband power. (F) Relative power changes between Low-Beta and High-Beta. A significant interaction (p < 0.05) occurred for Low-Beta/High-Beta. ∗Denotes p < 0.05 for follow up within-subject repeated measure ANOVAs by group, corrected for multiple pairwise comparisons. Alpha 1 = 8–10 Hz, Alpha2 = 10–12 Hz, Low-Beta = 12–18 Hz, High-Beta = 18–30 Hz, Sum = 1–30 Hz.

