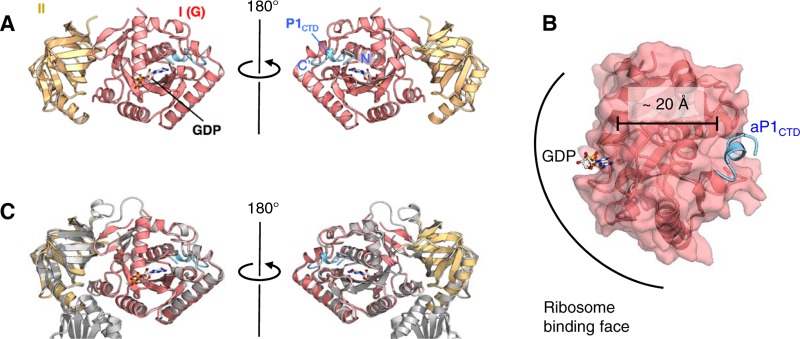
FIG 3.
Crystal structure of the aIF5BI-II-GDP-aP1CTD complex. (A) Overall structure of the aIF5BI-II-GDP-aP1CTD complex. The structures are represented by ribbon models. aIF5B domains I and II and aP1CTD are shown in red, yellow, and blue, respectively. The bound GDP is shown by a stick model. The N and C termini of aP1CTD are indicated as N′ and C′, respectively. (B) Distance between aP1CTD (blue) and GDP (stick model) bound to domain 1 of aIF5B (red). (C) Superimposition of the aP1CTD-bound form of aIF5BI-II-GDP and its aP1CTD-free form. aIF5BI-II-GDP-aP1CTD is colored as described above for panel A, and the aP1CTD-free form of aIF5B-GDP is shown in gray.

