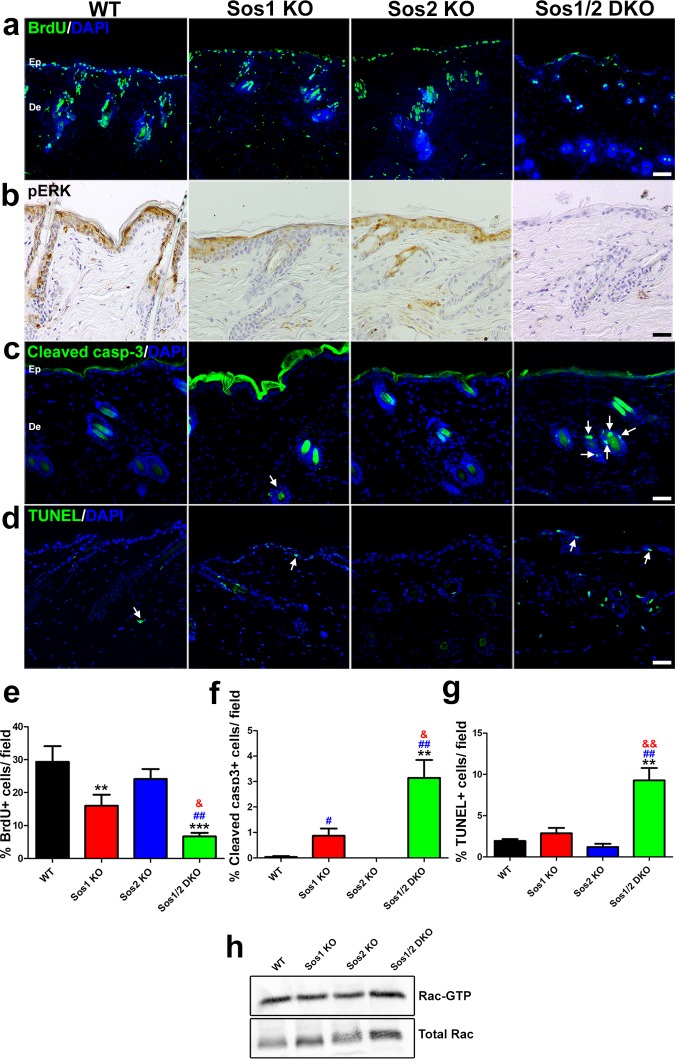
FIG 2.
Evaluation of keratinocyte proliferation and survival in the skin of WT and Sos1/2-KO mice. (a) Representative confocal microscopy images of skin sections of the four relevant genotypes after costaining for BrdU (green) and DAPI (4′,6′-diamidino-2-phenylindole; blue). Scale bar, 25 μm. (b) Representative immunostaining pictures of pERK detected in paraffin-embedded skin sections of the four relevant Sos genotypes. Scale bar, 50 μm. (c) Cleaved-caspase-3 (green) and DAPI (blue) colabeling performed in paraffin-embedded sections of skin from the four experimental groups. Arrows point to cleaved-caspase-3-positive cells in hair follicles. Note the nonspecific staining in the upper layers of the epithelium. Scale bar, 50 μm. (d) TUNEL (green) and DAPI (blue) colabeling performed in paraffin-embedded sections of skin from the four experimental groups. Arrows point to TUNEL-positive cells. Scale bar, 50 μm. (e) Percentage of BrdU-positive keratinocytes in skin of the indicated Sos genotypes per field. n = 4 per genotype (four microscopy fields per mouse). (f) Quantitation of percentage of cleaved-caspase-3-positive cells counted in the skin of the indicated Sos genotypes. n = 4 per genotype (four microscopy fields per mouse). (g) Quantitation of percentage of apoptotic, TUNEL-positive cells in skin of the indicated Sos genotypes. n = 4 per genotype (four microscopy fields per mouse). (h) Representative image of Rac-GTP pulldown assays. Normalized Rac-GTP/Total Rac ratios were as follows: WT = 1 ± 0.17, Sos1-KO = 0.77 ± 0.11, Sos2-KO = 0.98 ± 0.08, and Sos1/2-DKO = 0.61 ± 0.15. n = 3 per genotype. Data are expressed as means ± the SEM. (a to c) n = 3 per genotype (three sections per animal). (d) WT, n = 6; Sos1-KO, n = 4; Sos2-KO, n = 3; and Sos1/2-DKO, n = 7. & and #, P < 0.05 versus Sos1-KO and Sos2-KO, respectively; **, &&, and ##, P < 0.01 versus WT and Sos2-KO; ***, P < 0.001 versus WT. Ep, epidermis; De, dermis.

