FIG 3.
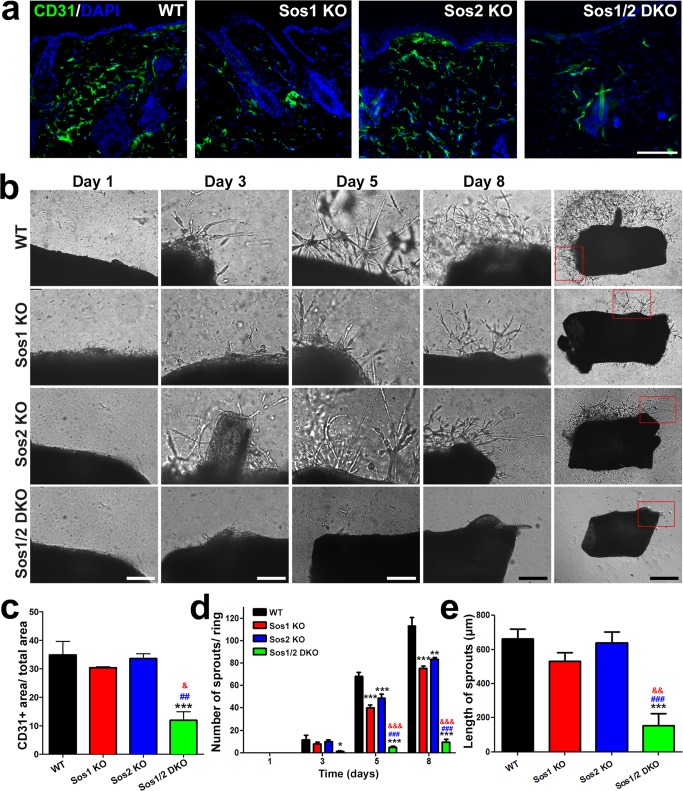
In vivo and ex vivo analysis of vascularization and angiogenesis in WT and Sos1/2-KO mice. (a) Representative confocal microscopy images of skin sections of the four relevant genotypes (WT, Sos1-KO, Sos2-KO, and Sos1/2-DKO) costained for CD31 (green) and DAPI (blue). Scale bar, 100 μm. (b) Representative images of aortic ring explant assays after the indicated times (1, 3, 5, and 8 days) in culture. Scale bars: 200 μm for day 1 to day 8 columns and 500 μm for the rightmost column, where the boxes enclose the areas magnified in the corresponding pictures under the day 8 column. (c) Quantitation of the CD31-positive immunolabeling area in the dermis of the four relevant Sos genotypes. n = 3 per genotype. (d) Quantitation of the number of sprouts counted in aortic ring assays performed on samples of the four relevant Sos genotypes at the indicated postexplant times (days) in culture. (e) Graphic representation of the average length of the sprouts generated by aortic rings of the four relevant Sos genotypes after 8 days of explant culture. n = 5 per genotype. Data are expressed as means ± the SEM. * and &, P < 0.05 versus WT; **, &&, and ##, P < 0.01 versus WT and Sos1-KO; ***, &&&, and ###, P < 0.001 versus WT, Sos1-KO, and Sos2-KO, respectively.

