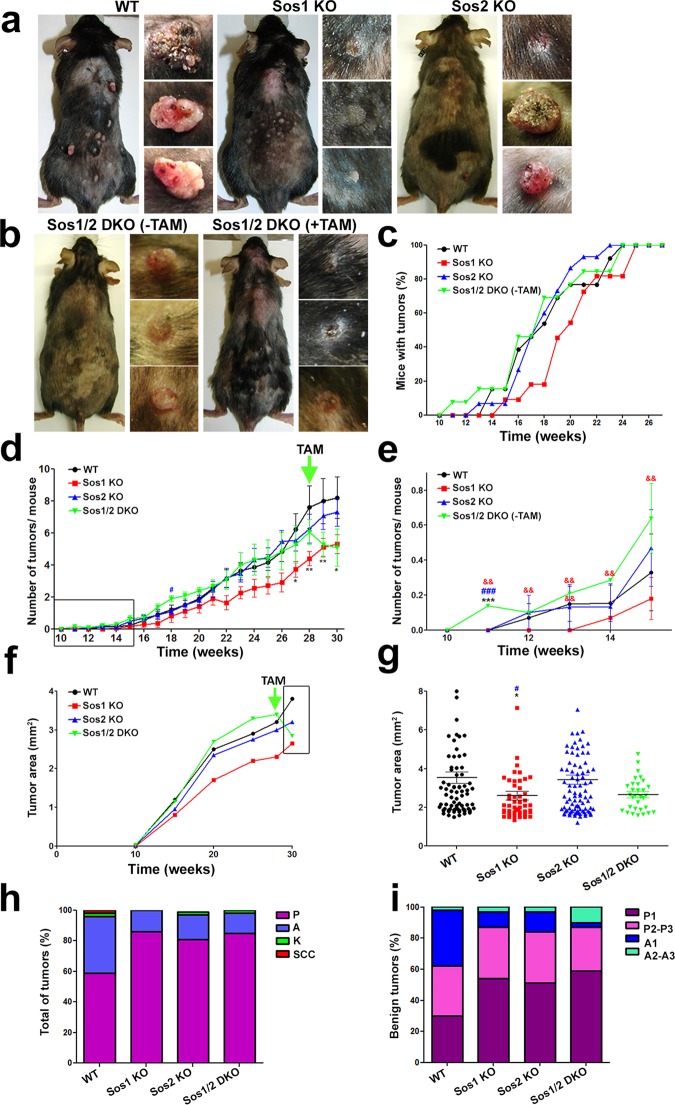
FIG 5.
DMBA/TPA-induced skin tumor initiation and progression in WT and Sos1/2-KO mice. (a) Representative images of TAM-treated, WT, Sos1-KO, and Sos2-KO mice and the tumors generated in each of those genotypes after undergoing 30 weeks of DMBA/TPA-induced carcinogenic treatment under protocol 1, as described in Materials and Methods. (b, left) Sos1/2-DKO(−TAM). Representative images are shown of a Sos1/2-DKO mouse and the dorsal skin tumors developed after 28 weeks of the DMBA/TPA carcinogenic treatment of mice of this particular genotype that were kept for this complete time period without the TAM treatment needed for Sos1 removal. (b, right) Sos1/2-DKO(+TAM). A representative image is shown of a mouse of the same Sos1/2-DKO genotype and the skin tumors observed in it at the 30-week time point mark of the DMBA/TPA carcinogenic protocol in Sos1/2-DKO mice that were only administered TAM (for Sos1 depletion) after previously undergoing 28 weeks of the carcinogenic protocol. (c) Percentage of mice showing development of tumors until week 28 of application of the carcinogenesis protocol to mice of the experimental groups depicted in panel a (TAM treated, WT, Sos1-KO, and Sos2-KO) or panel b (TAM untreated, Sos1/2-DKO). (d and e) Graphic representation of the number of tumors per individual mouse that appeared up to week 30 of our carcinogenic protocol in the indicated Sos genotypic groups. Notice that whereas WT and individual Sos1-KO and Sos2-KO mice were pretreated with TAM before undergoing the carcinogenic protocol, the DKO mice were only treated with TAM (for Sos1 depletion) after week 28 of the protocol. The arrow marks the start of TAM treatment for Sos1/2-DKO mice. The box in panel d encircles the time period amplified in more detail in panel e. (f and g) Evolution of the size of tumors arising in each experimental genotypic group. Data are expressed as the average area (mm2) of all tumors detected in the indicated experimental time points along the carcinogenic protocol. The arrow marks the time point where TAM treatment started for the group of Sos1/2-DKO mice. The box in panel f encloses the specific time period that is amplified to show data in more detail in panel g. (h) Percentage of the progressive histopathological grades identified in chemically induced tumors arising in mice of the indicated Sos genotypes. Tumor pathology stages were morphologically identified here as papilloma (P), sebaceous adenoma (A), keratoacanthoma (K), and squamous cell carcinoma (SSC). (i) Quantitative distribution of grades of histopathological progression within the benign tumors (adenomas and papillomas) counted in each of the four Sos experimental groups. Pathology progression stages were morphologically identified here as low-grade papilloma (P1), medium/high-grade papilloma (P2-P3), low-grade sebaceous adenoma (A1), and medium/high-grade sebaceous adenoma (A2-A3). Data are expressed as means ± the SEM. n = 13 for WT and Sos1/2-DKO, n = 11 for Sos1-KO, and n = 15 for Sos2-KO. * and #, P < 0.05 versus WT and Sos2-KO; ** and &&, P < 0.01 versus WT and Sos1-KO; ***, ###, and &&&, P < 0.001 versus WT, Sos1-KO, and Sos2-KO, respectively. TAM, tamoxifen.

