
Figure 2.
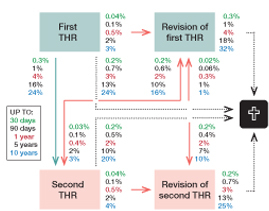
Multi-state analysis scheme and possible transitions. State 1 is the first hip replacement, state 2 is the second (contralateral) hip replacement, state 3 is the state where the first-performed hip is revised, whereas state 4 is the state where the contralateral hip is revised, and state 5 is death. The percentages stated are up to the 30- and 90-day mark as well as up to the 1-, 5-, and 10-year mark and represent the estimated transition probabilities within that given time.