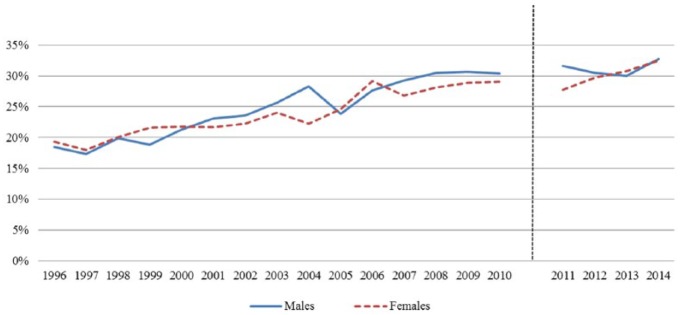
Figure 3.
Trends of obesity (BMI ⩾ 30) in adults by sex in Ohio, 1996-2014. BMI indicates body mass index.
Source: Centers for Disease Control and Prevention, National Center for Chronic Disease Prevention and Health Promotion, Division of Population Health. BRFSS Prevalence & Trends Data (online). 2015. Note: Data from 2011-present were weighted by age, sex, race/ethnicity, geography, marital status, education, home ownership, and telephone source using an iterative proportional fitting (raking) method. Data prior to 2011 were weighted by age and sex using a poststratification method. Thus, BRFSS data for 2011-present should not be compared with data prior to 2011.

