Figure 5.
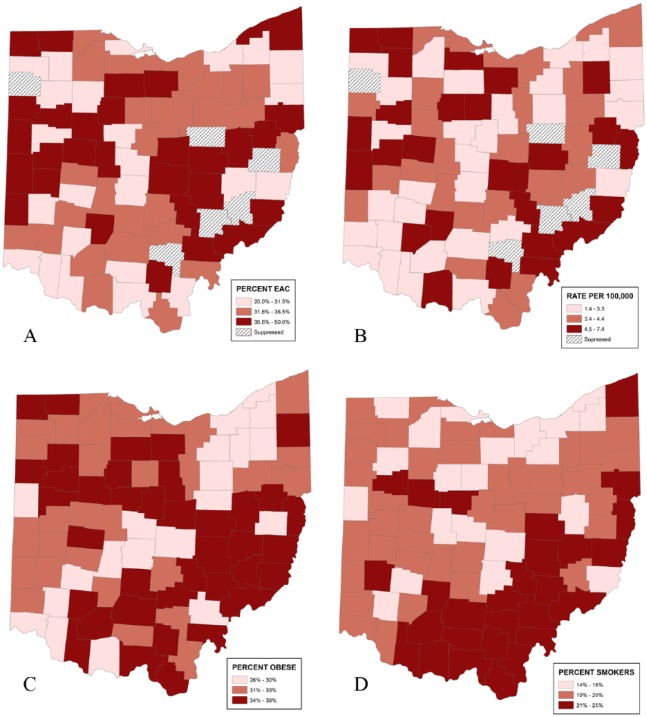
Geographic patterns of EAC and risk factors by county in Ohio. (A) Percent of esophageal cases that are EAC by county in Ohio, 2009-2013. (B) Average annual age-adjusted incidence rates of EAC by county in Ohio, 2009-2013. (C) Percent of obese (BMI ⩾ 30) adults by county in Ohio, 2012. (D) Percent of adults who are currently cigarette smokers by county in Ohio, 2014. BMI indicates body mass index; EAC, esophageal adenocarcinoma.
EAC Case Source: Ohio Cancer Incidence Surveillance System, Ohio Department of Health, 2016. All rates were age-adjusted to the 2000 US standard population using 19 age groups. Suppressed: rates not calculated when the case count for 2009-2013 was less than 5. Risk factor source: Centers for Disease Control and Prevention, National Center for Chronic Disease Prevention and Health Promotion, Division of Population Health.

