
FIGURE 10.
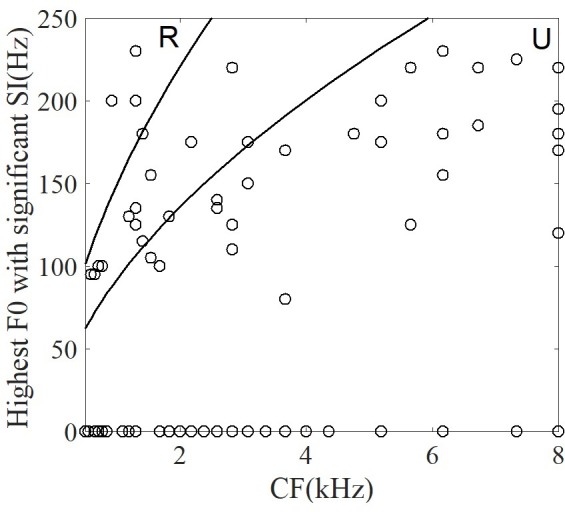
The correlation between the highest F0 with a significant SI and CF of single neuron. The two lines correspond to the range of resolvability (see ‘Discussion’). The harmonics of stimuli (upper left) around the CF would be resolved (‘R’ in figure), whereas the harmonics around CF (lower right) would be unresolved (‘U’ in figure).