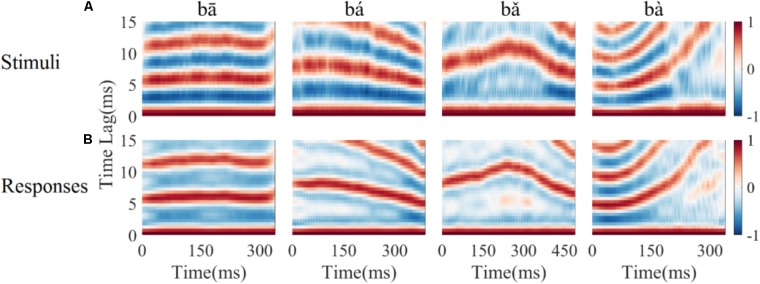
FIGURE 3.
Autocorrelograms of the stimuli (row A), and one representative LFP response (CF = 5.19 kHz) (row B). The time indicated on the horizontal axis represents the start of each 40 ms time bin calculated, the vertical axis represents the time lag (ms) between original signal and a time shifted copy signal, and colors represent the strength of correlation (red is positive, blue is negative).

