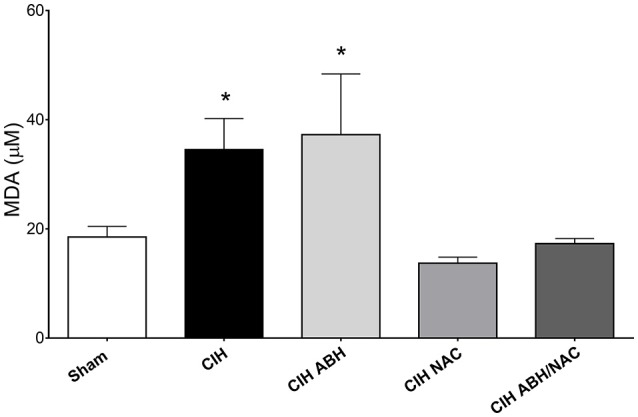
Figure 5.

Circulating levels of oxidized lipids in CIH-rats. Plasma levels of the oxidative stress marker MDA in sham (open bars, n = 16), CIH (solid bars, n = 13), CIH treated with ABH (light gray bars, n = 7), CIH treated with NAC (gray bars, n = 5), and CIH treated with ABH, and NAC (dark gray bars, n = 10) rats. Values expressed as mean ± SEM, *p < 0.05 vs. sham, ANOVA.
