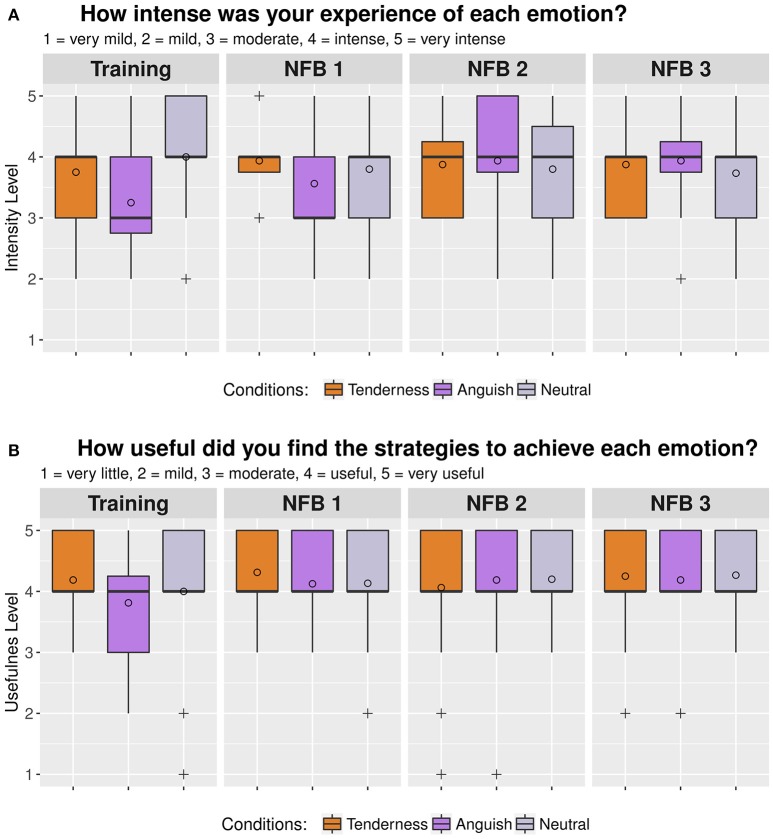
Figure 4.
Box plot of self-reported rating measured in eight participants over two consecutive assessment days immediately after each of the four MRI runs. (A) self-reported intensity of emotions during neurofeedback and (B) self-reported usefulness of strategies to up regulate emotions. The circles represent the mean values and the crosses represent outliers.

