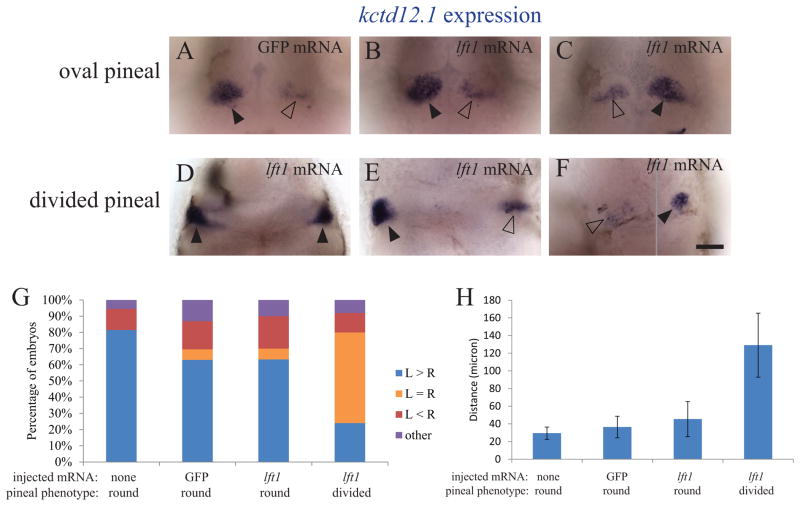
Figure 8. kctd12.1 expression in the habenulae becomes bilateral when the neural tube does not close.
foxd3:GFP embryos injected with GFP mRNA or lft1 mRNA and uninjected siblings were sorted by the pineal phenotype, fixed at 3 dpf, and then assayed for expression of kctd12.1 in the habenula nuclei. (A – C). When the pineal is oval shaped, kctd12.1 expression pattern is higher on the left than on the right. (D – F) When the pineal is divided, the habenula can either have (D) high levels of kctd12.1 in both the left and right sides, (E) higher expression on the left, or (F) higher expression on the right. The image in F is a composite, as the two habenula were in different focal planes. Closed arrowheads indicate the habenulae with higher level of kctd12.1 expression, open arrowheads the habenulae with lower kctd12.1 expression. (G) Distribution of the kctd12.1 expression patterns in each group of embryos. The embryos categorized as “other” (< 6%) had either a single kctd12.1 expression domain near the midline or many small areas of kctd12.1 expression. n ≥ 25 for each group. (H): The distance between the two habenulae measured at the points where they were closest to each other. n ≥ 13 for each group. Avg ± standard deviation. p < 0.001 by single-factor ANOVA. A Tukey-Kramer test finds significant differences between the divided pineal group and all other groups beyond 0.01 confidence level. The experiment was repeated two times and representative images are shown. All images are dorsal views, anterior to the top. Scale bar = 50 μm.

