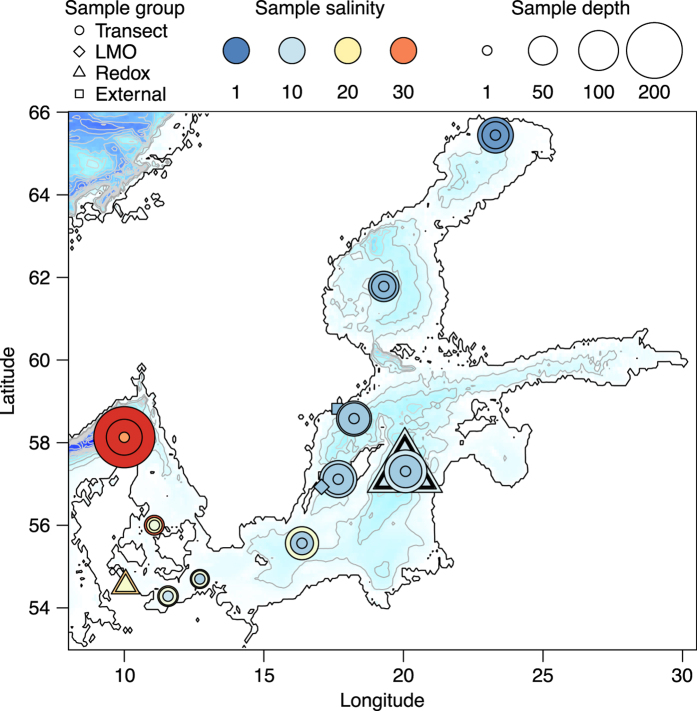
Figure 1. A map showing the locations for all stations where samples were taken.
The three sample groups included in the assembly (Transect, LMO and Redoxcline) are displayed together with the external sample set20 (External), all groups indicated with different markers. The colour of the marker indicates the salinity of the water sample while the size indicates the depth at which it was taken. The background color indicates depth (from white to dark blue), with contour lines drawn with 50 m intervals. The map was generated using the Marmap package36 in R37 with bathymetric data from the ETOPO1 dataset hosted on the NOAA server38.

