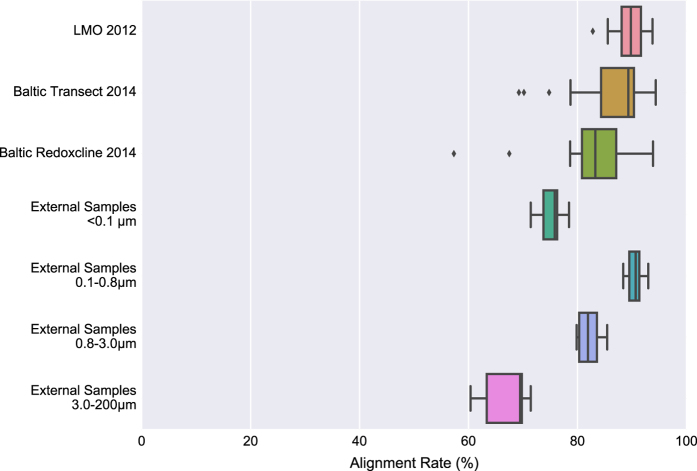
Figure 2. Mapping rates divided on different sample groups.
Mapping rates are calculated by Bowtie2 (ref. 30) as the “overall alignment rate”. The three first sample groups; LMO 2012 (N=37, 0.2–3.0 μm), Baltic Transect 2014 (N=30, >0.2 μm) and Baltic Redoxcline 2014 (N=6, 0.2–3.0 μm; N=6, >3.0 μm; N=2, >0.2 μm) were included in the assembly, while the four last sample groups; External Samples <0.1 μm (N=6), External Samples 0.1–0.8 μm (N=6), External Samples 0.8–3.0 μm (N=6) and External Samples 3.0–200 μm (N=6) were not. The size intervals of the external samples indicate filter pore sizes used to tentatively separate viruses, free-living prokaryotes, and small and larger particles as well as Eukaryotic cells, respectively34. Created using Matplotlib39 and Seaborn40.

