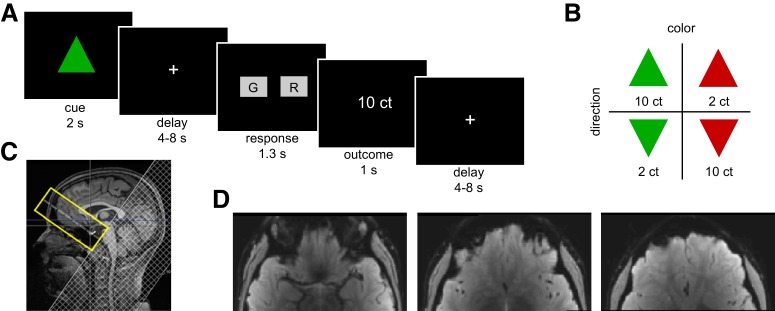
Figure 1.
Experimental design and the optimized rFOV imaging protocol. A, Illustration of experimental task structure. B, Examples of the visual dimensions of the CSs predicting reward. For half of the participants, the depicted CS-value association was inverted. C, Midsagittal view of a sample subject showing the rFOV (yellow) over the OFC and the saturation band (hatched area) for outer volume suppression with a sharp transition edge at the side slightly overlapping with the rFOV. D, Mean functional rFOV echoplanar image of a representative subject. ct, Cents.

