Figure 1.
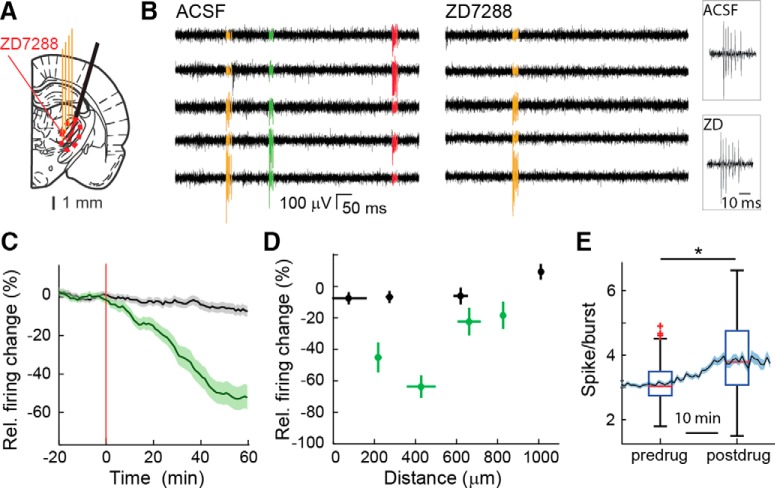
Temporal and spatial dynamics of the effect of ZD7288 applied by reverse microdialysis in the VB of ketamine/xylazine-anesthetized Wistar rats. A, Position of the unilateral four-shank silicone probe (4 thin orange lines) and microdialysis probe (black thick oblique line) on a rat brain schematic drawing at the level of the VB [modified from Paxinos and Watson (2007)]. The red circled, striped area indicates the diffusion of ZD7288 as measured in D. B, Extracellular high-pass filtered traces from five adjacent contact points of a silicone probe show high-frequency bursts of action potentials of three clustered (color-coded) TC neurons during ACSF (left) and ZD7288 (right) microdialysis application. Right, Enlargement of bursts from the same TC neuron before (top) and during (bottom) ZD7288 (ZD) dialysis. The same y-scale is shown for all traces. C, Time course of total firing of TC neurons during ACSF (black) and ZD7288 (green) microdialysis injection (500 μm in the inlet tube). Data are shown as percentage firing relative to that during ACSF (solid lines and shadows, mean ± SEM). The red vertical line (at time 0) indicates the start of ZD7288 application. Data from 87 and 45 neurons for ACSF and ZD7288, respectively, from 21 Wistar rats are shown (see Materials and Methods for further details). D, Distance profile of the ZD7288 effect (green) on total firing compared with ACSF (black; same number of neurons as in C). Horizontal bars indicate electrode position SDs relative to the dialysis membrane and calculated in 250 μm space bins, and vertical bars indicate SEM of ZD7288 effect. E, ZD7288-elicited increase in the number of spikes per burst (n = 45 neurons; solid line and shadows, mean ± SEM). Time is centered on the half-time of the effect of ZD7288 estimated by a logistic function fit on the total firing rate variation after ZD7288 application. The box plot indicates median (red), upper and lower quartiles (box edges), extreme points (whiskers), and outliers (red crosses; see Material and Methods, Experimental design and statistical analysis). Median postdrug (3.75 spikes/burst) is significantly higher than predrug (3.02 spikes/burst; *p = 6.9 10−5, Wilcoxon signed rank test.).

