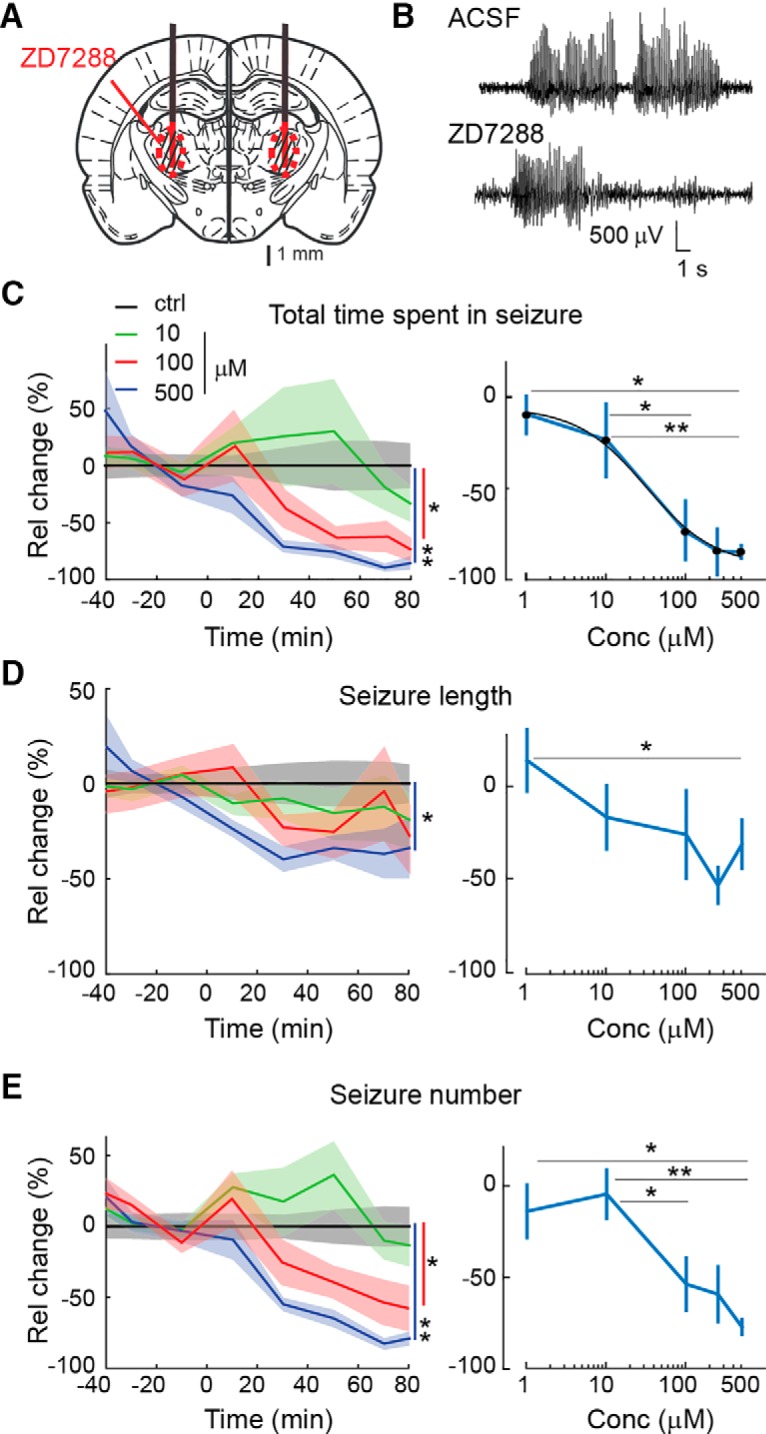
Figure 3.

Effect of bilateral microdialysis injection of ZD7288 in the VB on ASs in freely moving GAERS. A, Position of the bilateral microdialysis probes (black thick lines) and diffusion areas (red circled, striped areas) of ZD7288 are depicted on a rat brain schematic drawing at the level of the VB [modified from Paxinos and Watson (2007)]. B, Representative EEG traces showing spontaneous SWDs during ACSF and ZD7288 (500 μm in the inlet tube) microdialysis application. C, Time course (left) and concentration–response curve (right) of ZD7288 effect (solid line and shadows, mean ± SEM) on the total time spent in seizure normalized to ACSF values (see Materials and Methods for further details). The illustrated concentration color code refers to the ZD7288 concentration in the dialysis inlet tube. Time 0 indicates the start of ZD7288 dialysis. The number of animals is as follows: 9 (ACSF), 4 (1 μm), 8 (10 μm), 7 (100 μm), 2 (250 μm), and 6 (500 μm) [left, *p < 0.05, **p < 0.01, p = 0.023 (100 μm), and p = 4.10−4 (500 μm), Wilcoxon rank-sum test on averages between ACSF and 40–80 min data from the start of the ZD7288 application]. Absolute ACSF values (mean ± SEM) for the six reported time points are 295.4 ± 51.6, 308.8 ± 54.5, 276.7 ± 53.8, 275.2 ± 48.0, 219.1 ± 45.5, and 246.3 ± 52.5 s. A logistic fit of the concentration–response curve of ZD7288 indicate an EC50 of 29 μm. D, Same as C for the length of individual seizures. Absolute ACSF values (mean ± SEM) are 7.91 ± 1.29, 7.64 ± 1.33, 8.24 ± 1.28, 7.96 ± 1.33, 7.29 ± 1.25, and 6.13 ± 0.83 s (left, *p = 0.025, Wilcoxon rank-sum test). E, Same as C for the number of seizures. Absolute ACSF values (mean ± SEM) are 56.9 ± 10.4, 46.9 ± 8.6, 43.4 ± 9.1, 51.0 ± 11.7, 43.9 ± 11.2, and 45.6 ± 10.3 seizures (left, *p = 0.011, **p = 4.10−4, Wilcoxon rank-sum test).
