Figure 7.
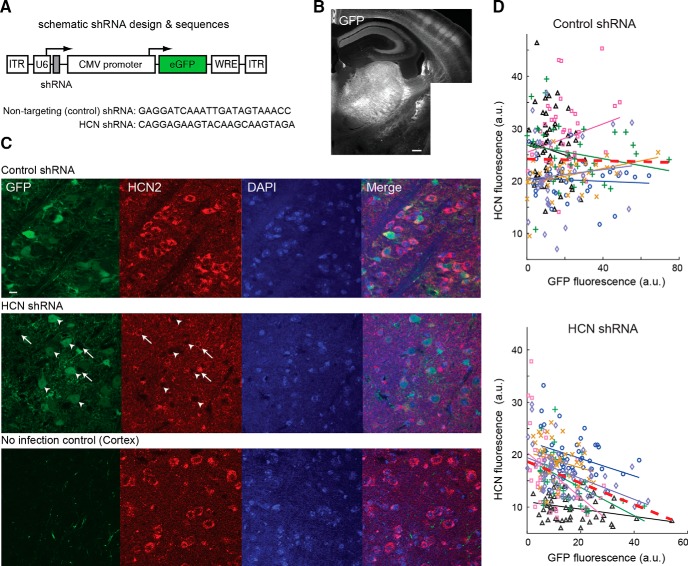
Genetic suppression of thalamic HCN channels decreases their expression in VB. A, AAV construct includes eGFP and shRNA targeting HCN subunits or nontargeting HCN subunits. B, Composite image showing GFP fluorescence restricted to thalamic nuclei and their projection to somatotopic cortical areas. Note barrels in somatosensory cortex. C, Top row, Confocal images showing GFP and intrinsic HCN2 expression in DAPI-positive VB TC neurons from a Stargazer mouse that received injections of the nontargeting control shRNA. Middle row, Same for a mouse that received injections of the shRNA targeting the HCN sequence. Note the low level (or absence) of HCN fluorescence in those TC neurons that express a high level of GFP signal (white arrowheads) compared with cells expressing a low level of GFP (white arrows). Bottom row, Same for a cortical area of the same mouse. Note the absence of GFP-positive soma in the cortical section and the low level of HCN signal in the thalamic section (scale bar, 10 μm). D, Quantifications of GFP and HCN expression in thalamic sections of Stargazer mice that received the nontargeting control shRNA (top) and the HCN targeting shRNA (bottom) for each neuron (symbols). Each line corresponds to the linear regression between the green (GFP) and the red (HCN) fluorescence of neurons from a single section. The same color line or symbols indicate cells of the same section. None of the correlations for the nontargeting control shRNA was significant (p = 0.31, 0.14, 0.23, 0.67, 0.051, and 0.59), whereas five of six sections from mice that received injections of the shRNA had a significant negative correlation (p = 0.041, 0.0006, 0.001, 0.03, 0.17, and 0.0001). Red dashed lines indicate the linear regression for the entire population of neurons (top, p = 0.77; bottom, p = 3.82 10−9).

