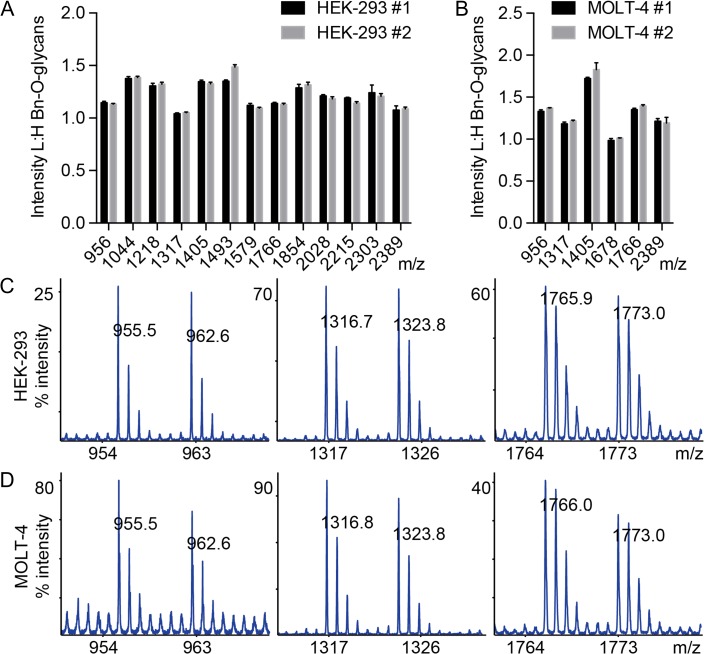
Fig. 4.
Mixing of heavy and light labeled Bn-O-glycans from model cell lines. 50 μM Ac3GalNAc-BnH7 and Ac3GalNAc-BnD7 were respectively added to HEK-293 (A,C) and MOLT-4 (B,D) cells and mixed 1:1 prior to permethylation and MALDI-TOF-MS analysis. (A,B) L:H ratios were calculated for major glycans from two separate experiments (n = 3). Representative spectra are shown for monosialyl core 1 (956 m/z), disialyl core 1 (1317 m/z), and disialyl core 2 (1766 m/z) for HEK-293 (C) and MOLT-4 (D) cells. The most abundant glycan over the complete m/z range (not depicted here) was set to 100% intensity (C,D). Masses correspond to compositions shown in Figure 3.

