Fig. 6.
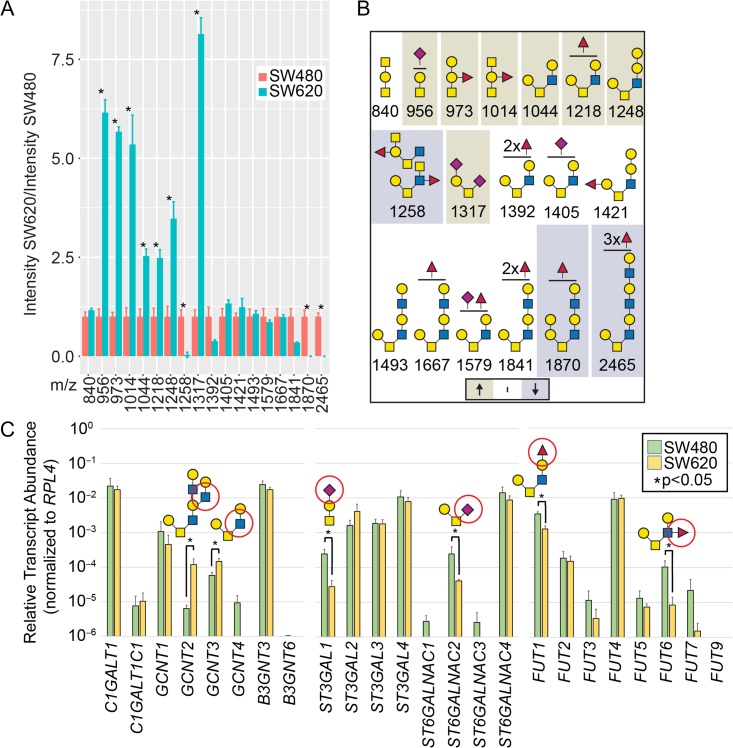
O-glycomics and qRT-PCR of colorectal cancer cells. (A) ICORA was used to evaluate SW480 versus SW620 colorectal cancer cells; L:H ratios of SW480:SW620 were normalized to L:H of SW480:SW480 cells (n = 3; *P ≤ 0.05 from two-way ANOVA with Tukey’s post hoc test for multiple comparison’s). (B) Glycan structures shown from A; beige are statistically increased and gray decreased as defined in A for SW620 v. SW480 cells; structures are inferred from glycan composition, biosynthetic pathways, and partially from MS/MS data to be presented in a separate manuscript. (C) qRT-PCR of O-glycogenes from SW480 and SW620 cells. Data are plotted on a log10 scale and error bars represent SD (n = 4). Select synthetic pathways circled in red (n = 4; *P ≤ 0.05 from Mann–Whitney U Test).

