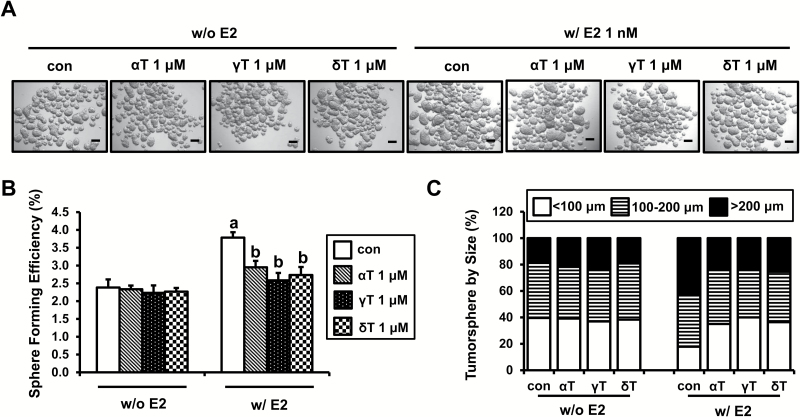
Figure 2.
Effects of tocopherols on formation and size of MCF-7 tumorspheres. (A) MCF-7 cells were plated at a density of 10000 cells/ml in ultra-low attachment six-well plates and grown for 4 days in the presence of E2 (1 nM) or/and α-, γ- and δ-tocopherols (1 μM). Representative pictures of MCF-7 tumorspheres are shown for phenotypic comparison, scale bar 100 μm. (B) SFE of MCF-7 tumorspheres is shown. SFE was calculated by dividing the number of tumorspheres (>100 μm) formed by the number of cells seeded presenting this as a percentage. The data are represented as mean ± SD. Here, n = 3 represents independent experiments in triplicate, a,bsignificantly different from the control and E2, respectively (P < 0.05). (C) The size of tumorspheres was divided into three ranges (<100, 100–200 and >200 μm). Average number of tumorspheres in each size range is shown in the graph.

