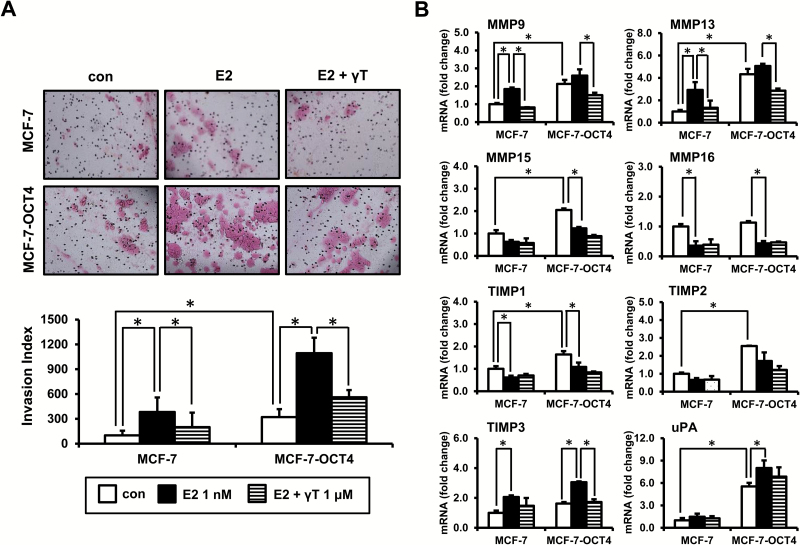
Figure 6.
γ-Tocopherol inhibits cell invasion induced by E2 and OCT4 overexpression. Cells were transfected with control vector (MCF-7) and pSin-EF2-OCT4-Pur vector (MCF-7-OCT4) for 24 h, and then, cells were treated with E2 (1 nM) and/or γ-tocopherol (1 μM) for an additional 24 h. (A) Cells (8 × 10⁴ cells/ml) were loaded onto transwells coated with Matrigel. After 22-h incubation, the transwells were stained with H&E stain (top). Representative pictures are shown, ×10 magnification. The number of invading cells was counted in three representative fields per membrane, and the relative percentage of invasive cells was calculated from three independent experiments (bottom). (B) qPCR analysis was performed to detect genes involved in cell invasion, including MMP9, MMP13, MMP15, MMP16, TIMP1, TIMP2, TIMP3 and uPA. The data are represented as mean ± SD. n = 3 independent experiments. Cycle numbers for genes related to MMP9, MMP13, MMP15, MMP16, TIMP1, TIMP2, TIMP3 and uPA for MCF-7 control group were 27, 28, 25, 23, 22, 23, 24 and 27, respectively. *Significantly different from the respective control (P < 0.05).

