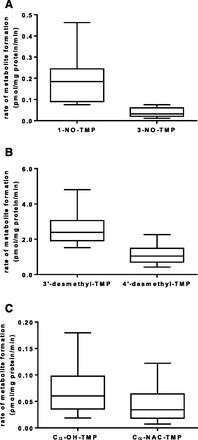
Fig. 2.

Variability in the formation rates of trimethoprim primary metabolites. TMP (5 µM) was incubated with HLMs prepared from individual donors (n = 16) as described under Materials and Methods. Microsomes from each donor were incubated in triplicate. Box and whisker plots were constructed for the rate of formation for each metabolite. The box extends from the 25th to the 75th percentile with the line in the middle at the median. The whiskers extend to the minimum and maximum values, respectively. (A) TMP N-oxidation (1- and 3-NO-TMP). (B) TMP demethylation (3′- and 4′-desmethyl-TMP). (C) TMP Cα-oxidation (Cα-OH-TMP and Cα-NAC-TMP).
