
Fig. 4.
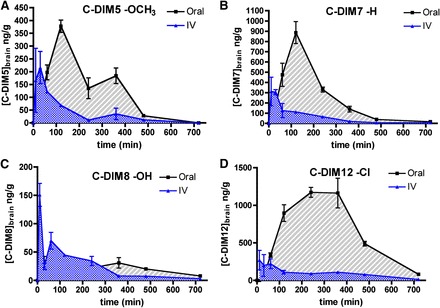
Brain pharmacokinetic distribution of C-DIM compounds. Brain tissue concentrations for C-DIM compounds and relationship between route of exposure and concentration in brain. Points represent mean brain tissue level for either IV (blue) or oral gavage (black) of C-DIM5 (A), C-DIM7 (B), C-DIM8 (C), or C-DIM12 (D) over a period of 12 hours (n = 3 animals per time point for each route of exposure); data are expressed as mean ± S.E.M.