
Figure 3.
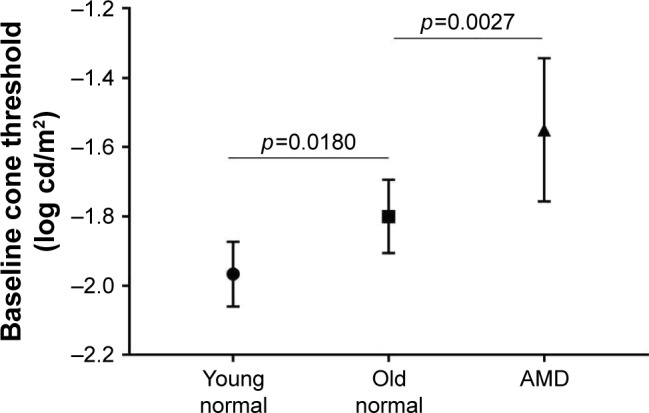
Baseline cone threshold.
Notes: ANOVA with the Satterthwaite approximation and Tukey–Kramer p-value adjustment was used to compare normal young and old subjects as well as age-matched older normal and AMD subjects. Scatterplot with error bars representing the standard deviation.
Abbreviations: AMD, age-related macular degeneration; ANOVA, analysis of variance.