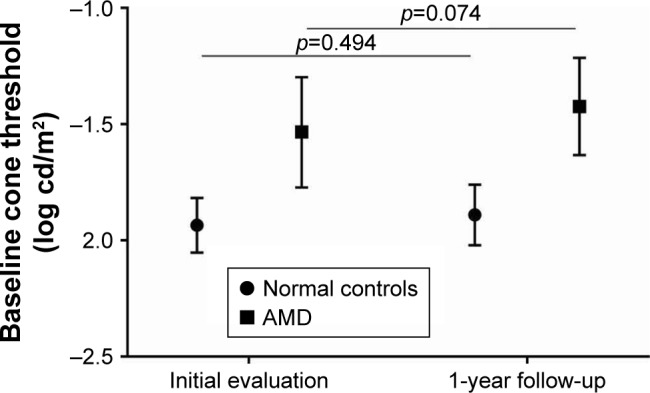
Figure 5.

Baseline cone threshold change for repeated subjects.
Notes: Baseline cone threshold means were compared from the baseline year to the 1-year follow-up using Satterthwaite ANOVA; error bars represent the standard deviation.
Abbreviations: AMD, age-related macular degeneration; ANOVA, analysis of variance.
