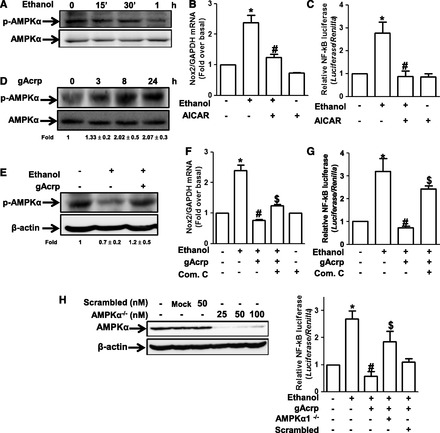
Fig. 4.

Role of AMPK signaling in the suppression of ethanol-induced Nox2 expression by gAcrp in RAW 264.7 macrophages. (A) Cells were incubated with 100 mM ethanol for the indicated time periods. The level of phosphorylated AMPKα was measured by Western blot analysis as described previously. Images are representative of three independent experiments that showed similar results. Band intensities were quantified by densitometric analysis and normalized by total AMPK. Values are represented as fold changes relative to controls and are expressed as mean ± S.E.M. (n = 3). (B) Cells were pretreated with AICAR (1 mM), an activator of AMPK, for 1 hour, followed by stimulation with 100 mM ethanol for 18 hours. Nox2 mRNA levels were measured by qRT-PCR. Values represent fold change relative to the control cells and are expressed as mean ± S.E.M. (n = 3). *P < 0.05 compared with cells not treated with ethanol; #P < 0.05 compared with cells treated with ethanol. (C) Cells were cotransfected with pNFκB-Luc plasmid and Renilla control reporter gene as described previously. After 24 hours of transfection, cells were preincubated with AICAR (1 mM) for 1 hour, followed by treatment with 100 mM ethanol for additional 24 hours. Transcriptional activity of NF-κB was assessed by reporter assay. Values are the results of six separate experiments and are expressed as mean ± S.E.M. (n = 6). *P < 0.05 compared with the cells not treated with ethanol; #P < 0.05 compared with cells treated with ethanol. (D) Cells were treated with gAcrp (0.1 μg/ml) for the indicated periods. The level of phosphorylation of AMPKα was analyzed by Western blot analysis. Band intensities were quantified by densitometric analysis and normalized by total AMPKα. Values are represented as fold changes relative to control and are expressed as mean ± S.E.M. (E) Cells were pretreated with 0.1 μg/ml of gAcrp for 18 hours, followed by stimulation with 100 mM ethanol for 1 hour. The level of AMPKα phosphorylation was measured by Western blot analysis. Representative images from three independent experiments are shown along with β-actin for loading control. Band intensities were quantified by densitometric analysis and normalized by β-actin. Values are represented as fold changes relative to control and are expressed as mean ± S.E.M. (F) Cells were pretreated with 0.1 μg/ml of gAcrp for 18 hours in the absence or presence of compound C (1 μM), an AMPK inhibitor, followed by 100 mM ethanol treatment. Nox2 mRNA was analyzed by qRT-PCR as described previously. Values are the results of four separate experiments and presented as mean ± S.E.M. (n = 4). *P < 0.05 compared with cells not treated with ethanol; #P < 0.05 compared with cells treated with ethanol. (G) Cells were transiently cotransfected with pNFκB-Luc plasmid and Renilla reporter gene as described previously. After 24 hours of culture, cells were pretreated with 0.1 μg/ml of gAcrp for 18 hours in the absence or presence of compound C (1 μM), followed by incubation with 100 mM ethanol for additional 24 hours. Transcriptional activity of NF-κB was assessed by luciferase reporter assay as described previously. Values are expressed as fold increase relative to control cells, mean ± S.E.M. (n = 3). *P < 0.05 compared with cells not treated with ethanol; #P < 0.05 compared with cells treated with ethanol; $P < 0.05 compared with cells treated with gAcrp and ethanol. (H) Upper panel: Cells were transfected with different concentrations of siRNA targeting AMPKα1 or scrambled siRNA. After overnight incubation, expression level of AMPKα was determined by Western blot analysis. Lower panel: Cells were transfected with siRNA targeting AMPKα (25 nM) or scrambled control siRNA. After 6 hours’ incubation, cells were then cotransfected with pNFκB-Luc plasmid and Renilla reporter gene. After overnight incubation, cells were pretreated with gAcrp (0.1 μg/ml) for 18 hours, followed by 100 mM ethanol stimulation for additional 24 hours. Transcriptional activity of NF-κB was determined by luciferase reporter assay. Values are presented as fold change relative to control cells and expressed as mean ± S.E.M. (n = 3). *P < 0.05 compared with cells not treated with ethanol; #P < 0.05 compared with cells treated with ethanol.
