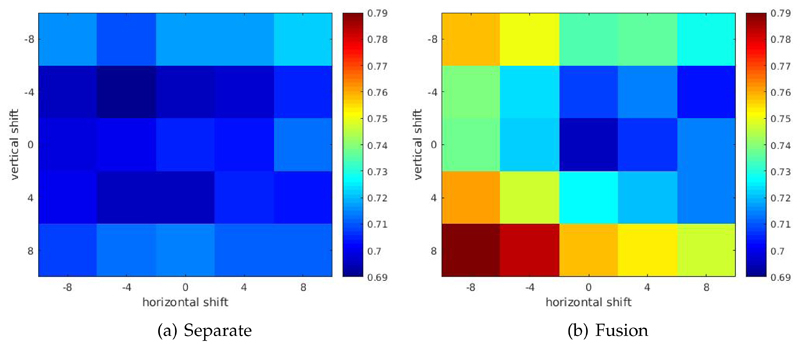
Figure 6.
Heatmap plot of feature distances between manually translated pre-aligned CT-MR image pair. For fusion model, both horizontal and vertical shift in patch extraction location of CT image patch induce an increase in feature distance between CT and MR image patch pair. This is not exhibited for separately trained models.

