
Figure 3. SKN-1::GFP nuclear localization.
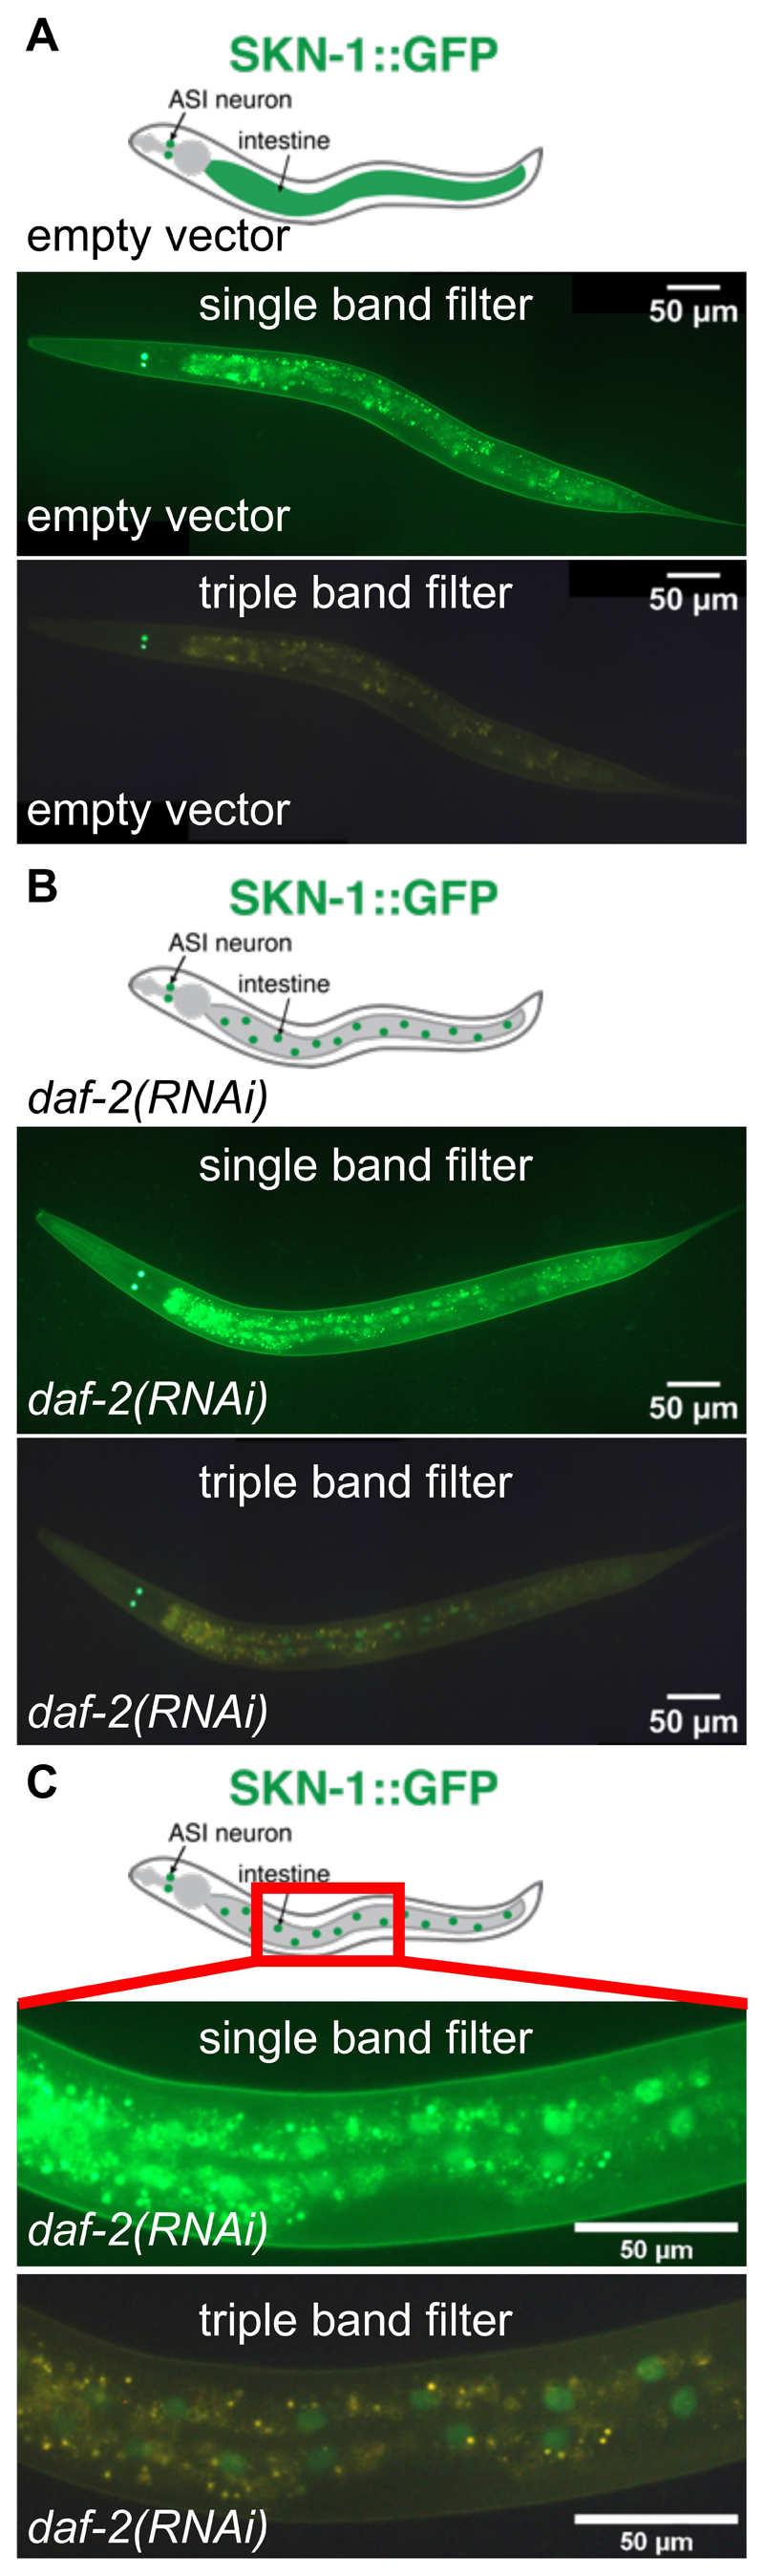
In (A) and (B), the same transgenic LD1 ldIs007 [Pskn-1::skn-1b/c::gfp] C. elegans (anterior to the left, ventral side down) at larval stage 4 (L4) is imaged with the single band filter set (middle panel; 1/30 sec exposure time) or the triple band filter set (bottom panel; 1/30 sec exposure time). Top panel shows schematic representation of SKN-1::GFP depicted in green. A. Transgenic LD1 C. elegans imaged at L4 larval stage fed with control RNAi bacteria carrying an empty vector (L4440), starting from the L1 larval stage. SKN-1::GFP is diffuse and barely visible in the intestine. Note that green signal observed in the intestine here is mainly gut autofluorescence. B. Transgenic LD1 C. elegans imaged at L4 larval stage treated with daf-2 RNAi (which reduces insulin/IGF-1 signaling), starting from the L1 larval stage. SKN-1::GFP is localized in the intestinal nuclei and prominently visible with the triple band filter sets by displaying the GFP in green and the autofluorescence in yellow.
Note: Treatment of daf-2(RNAi) does not increase skn-1 expression levels (Tullet et al., 2008; Ewald et al., 2015). (C) shows a magnified section (1/30 sec exposure time) indicated by the red box in the schematic (top panel). For (A) and (B), images were stitched together using ImageJ (https://imagej.net/Image_Stitching) (Preibisch et al., 2009).