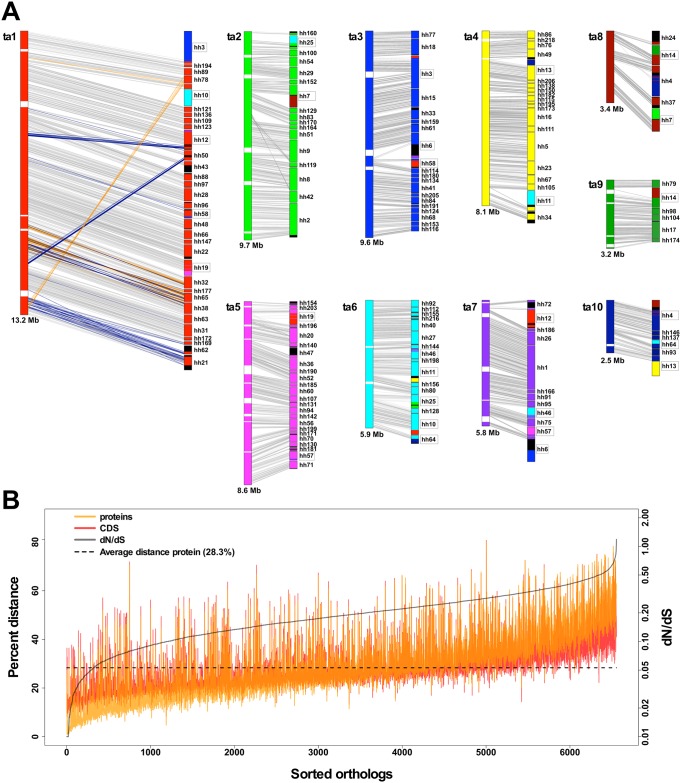
Fig 2. Extensive genomic structural differences and significant genetic divergence between T. adhaerens and H. hongkongensis.
(A) Scaled schematic drawings of the 10 longest T. adhaerens scaffolds on the left (ta1–ta10) and matching H. hongkongensis contigs on the right. While a general macrosynteny between the two placozoan species is present (gray lines), 25% of the genes are translocated (blue lines) or inverted (orange lines) relative to the order of the respective T. adhaerens scaffold (illustrated for ta1). Often, entire gene blocks are translocated (different colors in boxed H. hongkongensis contigs). Black stretches mark genomic regions not matching any of the 10 T. adhaerens scaffolds, while white stretches mark gaps in the T. adhaerens scaffolds. (B) Pairwise protein and CDS distances for 6,554 one-to-one orthologous genes. A significant fraction of orthologs have larger protein than CDS distance, but only three of these are, in fact, positively selected (reflected by dN/dS ratios > 1, gray line). Orthologs are sorted by increasing dN/dS. Calculated distances can be found in the H. hongkongensis data repository at https://bitbucket.org/molpalmuc/hoilungia-genome/src/master/orthologs/. CDS, coding sequence; dN/dS, nonsynonymous to synonymous nucleotide substitutions.

