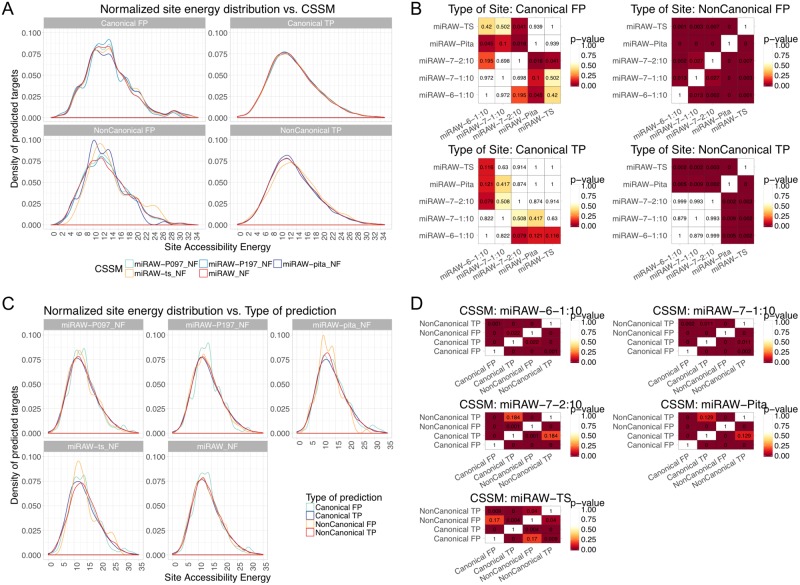
Fig 10.
Energy distributions of the site accessibility energy ΔGopen for target sites predicted by miRAW using different CSSMs (a) ΔGopen distributions grouped by the type of site identified by each CSSM (with extreme values removed for comparative purposes). Blue curves correspond to non-canonical CSSMs, red and yellow curves correspond to canonical CSSMs. In general, ΔGopen distributions are smoother for true positive sites (for both canonical and non-canonical CSSMs) than for false positive sites. (b) Pairwise comparison for statistical significance among CSSMs (Kolmogorov-Smirnov test (p < 0.05)). The most striking differences are between the ΔGopen distributions of non-canonical false positive sites, with differences identified between all CSSMs. For non-canonical true positive sites, statistical significance is only identified between canonical (miRAW-TS, miRAW-Pita) and the non-canonical (miRAW specific) CSSMs. For canonical sites, there are fewer significant differences; this can be explained by the fact that all the CSSMs identify similar MBSs. (c) Same energy distribution data in (a), but grouped by the CSSMs used for identifying the sites. The smoother distribution of the true positives is also apparent in these plots. (d) Pairwise comparisons of the different site types identified by each CSSM (TP/FP and canonical/non-canonical)—(Kolmogorov-Smirnov test (p < 0.05)).

