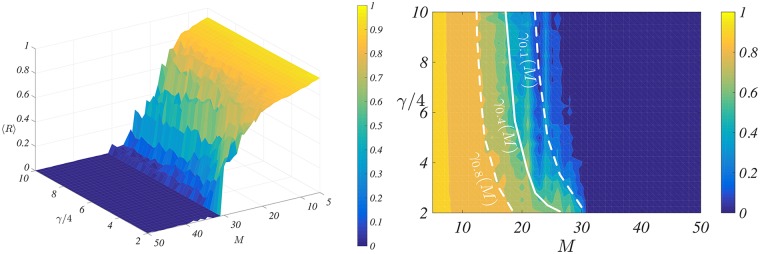
Fig 3. The Kuramoto order parameter as a function of number of microelectrodes and the strength of the control.
Left panel: for each couple (M, γ/4) ∈ [5, 50] × [2, 10] we numerically simulate the controlled system (12) involving N = 100 oscillators interconnected using an all-to-all topology, with coupling parameter K = 0.5 and frequencies ωi drawn from a normal distribution . Each point is the average over 50 independent realisations (different initial conditions but same frequencies). Right panel: a different visualisation of 〈R〉 allowing to emphasise the relation γr(M), r = 0.8 (dashed curve), r = 0.4 (dotted curve) and r = 0.1 (solid curve); let us stress that the latter curves have been draw with a visual guide scope and have not been analytically determined.

