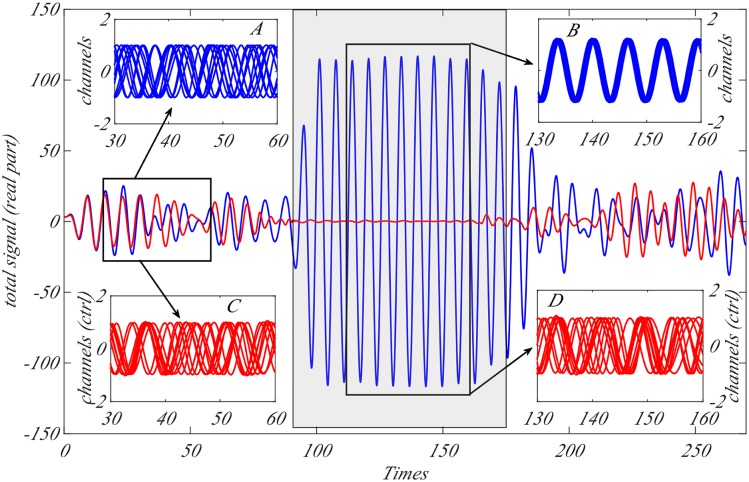
Fig 6. Onset of an epileptic seizure in the Stuart-Landau-like neurons population and the outcome of the controlled system.
In the main plot, we represent the (real part of the) total signal ∑k ρk cos ϕk (blue curve for the SL model and red curve for the controlled one) as a function of time for N = 100 coupled oscillators coupled by a Newman-Watts small-world network [55] with parameter p = 0.85 and M = 20 microelectrodes for the controlled case and γ/4 = 4.25. We assume K to be small, namely fluctuating around the average value 0.1, in the interval [0, ∼ 90]; during this period of time both systems behave similarly and do not exhibit synchronisation (see inset A for the SL model and inset C for the controlled SL model). Then we assume the coupling parameter to start to increase to eventually remain quite large, on average 0.5, in the time interval [∼ 90, ∼170]; we can observe that the SL synchronises (see inset B) while the controlled version still exhibit a non-synchronised regime (see inset D). Once the coupling parameter decreases and fluctuates again around a small value, 0.1, both systems recover the same non-synchronised state (data not shown).

