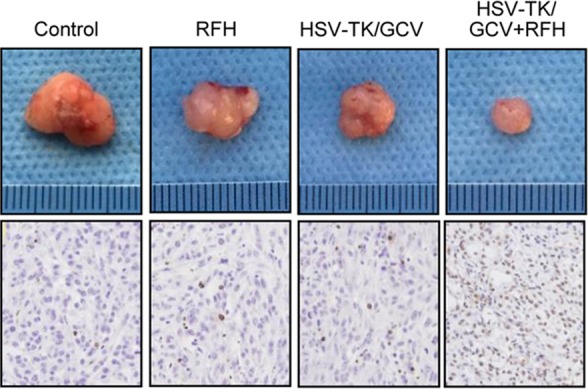
Figure 4c:

In vivo experiments for establishing proof of principle by using nude mice with subcutaneous xenografts of lung tumors. Bioluminescence imaging and US were used to monitor responses of tumors to different treatments over time (herpes simplex virus [HSV] thymidine kinase [TK]/ganciclovir [GCV] plus radiofrequency hyperthermia [RFH], RFH alone, HSV-TK/GCV alone, and phosphate-buffered saline). (a) X-ray and optical imaging revealed a significant decrease of mean photon signals (red-yellow) in the combination therapy group (mean: HSV-TK/GCV plus RFH, 0.71 [95% confidence interval {CI}: 0.03, 1.39] vs RFH, 2.66 [95% CI: 1.73, 3.59]; HSV-TK/GCV, 1.37 [95% CI: 0.65, 2.08]; and phosphate-buffered saline, 3.07 [95% CI: 2.50, 3.65]; P <.001). Error bars show the standard deviation. (b) US showed that the smallest mean tumor size occurred with combination therapy compared with the other treatments (mean: HSV-TK/GCV plus RFH, 0.60 [95% CI: 0.15, 1.05] vs RFH, 2.43 [95% CI: 1.80, 3.06]; HSV-TK/GCV, 1.32 [95% CI: 0.75, 1.89]; and phosphate-buffered saline, 2.56 [95% CI: 1.75, 3.38]; all P <.05). Error bars show the standard deviation. (c) Assessment of gross specimens of tumors confirmed that the smallest tumor size occurred in the combination therapy group (upper panel). Terminal deoxynucleotidyl transferase–mediated 2ʹ-deoxyuridine, 5ʹ-triphosphate nick end labeling staining for apoptosis analysis (original magnification, ×200) displayed more apoptotic cells (brown stains, lower panel) in the combination therapy group than in the other groups (mean: HSV-TK/GCV plus RFH, 0.41 [95% CI: 0.36, 0.46] vs RFH, 0.04 [95% CI: 0.02, 0.06]; HSV-TK/GCV, 0.11 [95% CI: 0.07, 0.14]; and phosphate-buffered saline, 0.01 [95% CI: −0.06, 0.03]; all P < .001). (d) Western blotting analysis confirmed a significant increase of GFP gene expression in tumors treated with RFH compared with tumors without RFH treatment (mean: [green fluorescent protein [GFP]/HSV-TK plus RFH, 1.79 [95% CI: 1.32, 2.26] vs GFP/HSV-TK, 1.00 [95% CI: 1.00, 1.00]; P < .01; n = 6 per group]. Error bars show the standard deviation. GAPDH = glyceraldehyde 3-phosphate dehydrogenase. * = P < .05, ** = P < .01, and *** = P < .001.
