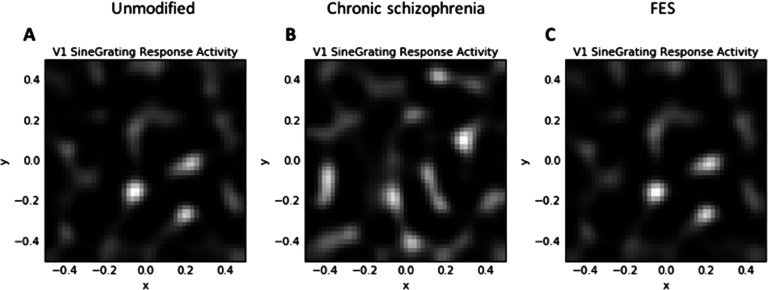
Figure 5. .
V1 retinotopic activation maps showing response to the medium-SF stimulus at 80% contrast. A) The unmodified GCAL model after 20,000 iterations (mean activation 0.137; max. = 0.587). B) The best fitting model for chronic schizophrenia data (mean activation = 0.140, max. = 0.550). C) The best fitting model for FES data (mean activation = 0.131; max. = 0.564). Note that, as predicted, at this higher SF, activation is higher than shown in Figure 4. Also note that a greater spread of activation can be seen in the chronic schizophrenia model compared to the other models (i.e., there is activation of orientation-selective simple cells that are not activated in the other models). This greater activation of orientation-selective cells that are normally relatively silent may be the basis of broadened orientation tuning in this group.

