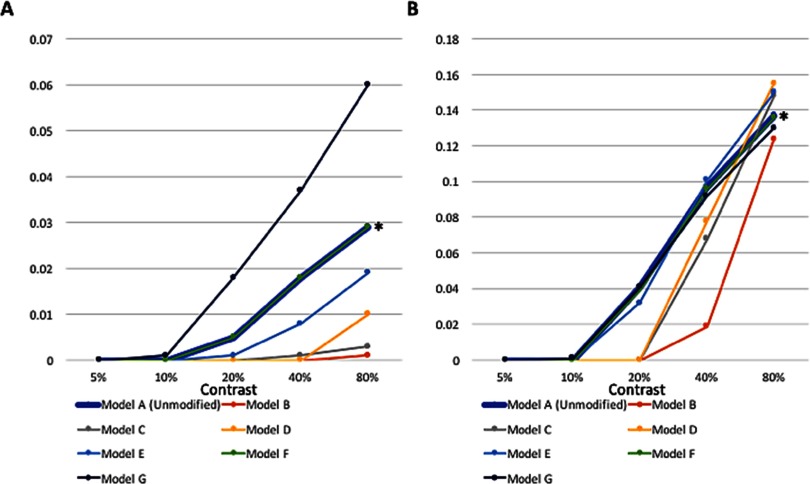
Figure 9. .
Activation values (y axis, in arbitrary units) across contrast levels for the unmodified GCAL model, after 20,000 iterations, and several alternative schizophrenia models discussed in the text. Left: activity in response to the low-SF stimulus. Right: activity in response to the medium-SF stimulus. Model A (unmodified), represented by the thick blue line, is the basic GCAL model. All other models represent cases with perturbations at the 10,001st iteration, as follows: Model B, 25% increase in V1 lateral excitation; Model C, 25% reduction in V1 lateral inhibition; Model D, 20% increase in V1 lateral excitation and an increase in the V1 excitatory learning rate to 0.01; Model E, 10% reduction in V1 lateral inhibition and an increase in the V1 excitatory learning rate to 0.01; Model F (barely visible owing to almost complete overlap with Model A, but indicated by an asterisk), an increase in the V1 afferent learning rate to 0.03 without any change to lateral inhibition; Model G, 15% reduction in both retinal and LGN efferents in combination with an increase in the V1 afferent learning rate to 0.03. Note that although Models G in the left panel and F in the right panel are reasonable fits to previously published FES CS data, and although Models E in the left panel and C and D in the right panel are reasonable fits to previously published chronic schizophrenia data, none of these models are a good fit across both the left and right panels. Results for these same models are also depicted in Figure 10.

