. 2018 Jul 13;7:e37439. doi: 10.7554/eLife.37439

Figure 3. Molecular phylogenetic analysis of LbpA proteins by maximum likelihood method.

First, the best amino acid substitution model was calculated in MEGA7 (Kumar et al., 2016). The Le_Gascuel_2008 model (Le and Gascuel, 2008) had the lowest BIC (Bayesian information Criterion) score and was considered to describe the substitution pattern the best. The evolutionary history was then inferred by using the Maximum Likelihood method based on this model. The tree with the highest log likelihood (−5373.74) is shown. Bootstrap values given at branching points are based on 1000 replicates. Initial tree(s) for the heuristic search were obtained automatically by applying Neighbor-Join and BioNJ algorithms to a matrix of pairwise distances estimated using a JTT model, and then selecting the topology with superior log likelihood value. A discrete Gamma distribution was used to model evolutionary rate differences among sites (5 categories (+G, parameter = 0.8540)). The tree is drawn to scale, with branch lengths measured in the number of substitutions per site. The analysis involved 68 amino acid sequences. All positions containing gaps and missing data were eliminated. There were a total of 123 positions in the final alingment. Evolutionary analyses were conducted in MEGA7 (Kumar et al., 2016).

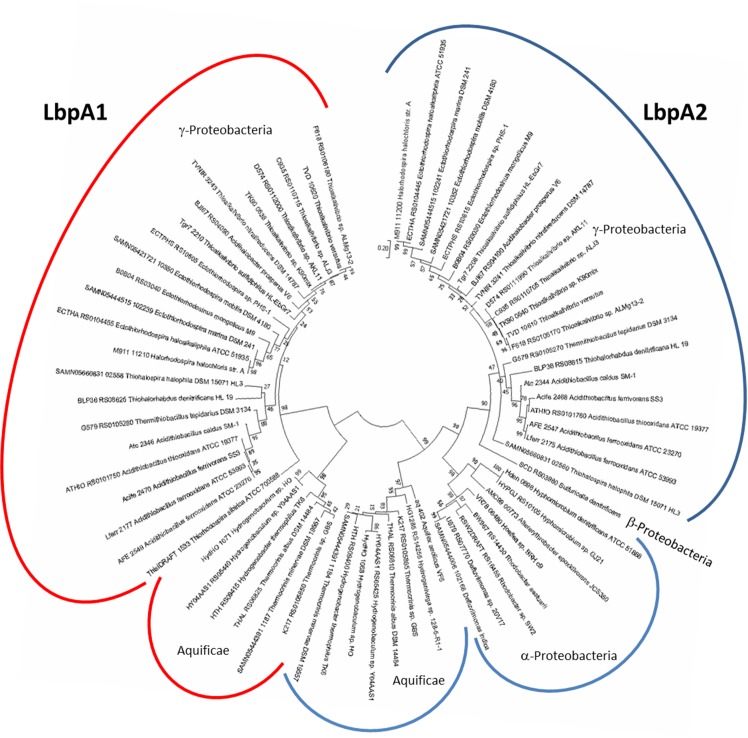
Figure 3—source data 1. List of source organisms, locus tags and accessions for the LbpA and GvcH proteins considered in phylogenetic trees shown in Figure 3 and Figure 3—figure supplement 1.
DOI: 10.7554/eLife.37439.008

Figure 3.

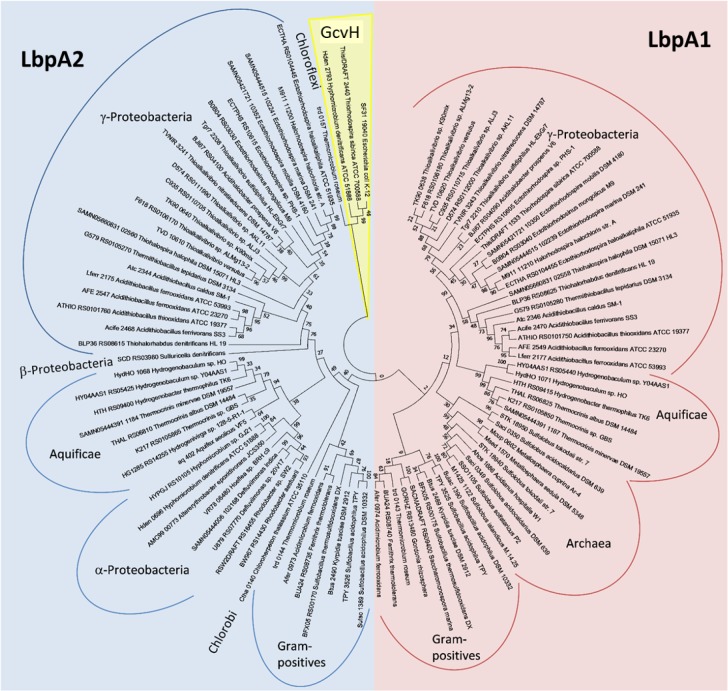
Figure 3—figure supplement 1. Molecular phylogenetic analysis of LbpA and GvcH proteins by maximum likelihood method.

Figure 3—figure supplement 1.

Three bona fide GvcH proteins were included in the analysis (GcvH from Escherichia coli K12 substr. W3110 (BAE76969), ThisiDRAFT_2440 from Thiorhodospira sibirica, and Hden_2793 from Hyphomicrobium denitrificans). First, the best amino acid substitution model was calculated in MEGA7(Kumar et al., 2016). The Le_Gascuel_2008 model (Le and Gascuel, 2008) had the lowest BIC (Bayesian information Criterion) score and was considered to describe the substitution pattern the best. The evolutionary history was then inferred by using the Maximum Likelihood method based on this model. The tree with the highest log likelihood (−5373.74) is shown. Bootstrap values given at branching points are based on 1000 replicates. Initial tree(s) for the heuristic search were obtained automatically by applying Neighbor-Join and BioNJ algorithms to a matrix of pairwise distances estimated using a JTT model, and then selecting the topology with superior log likelihood value. A discrete Gamma distribution was used to model evolutionary rate differences among sites (5 categories (+G, parameter = 0.8540)). The tree is drawn to scale, with branch lengths measured in the number of substitutions per site. The analysis involved 98 amino acid sequences. All positions containing gaps and missing data were eliminated. There were a total of 123 positions in the final alingment. Evolutionary analyses were conducted in MEGA7 (Kumar et al., 2016).