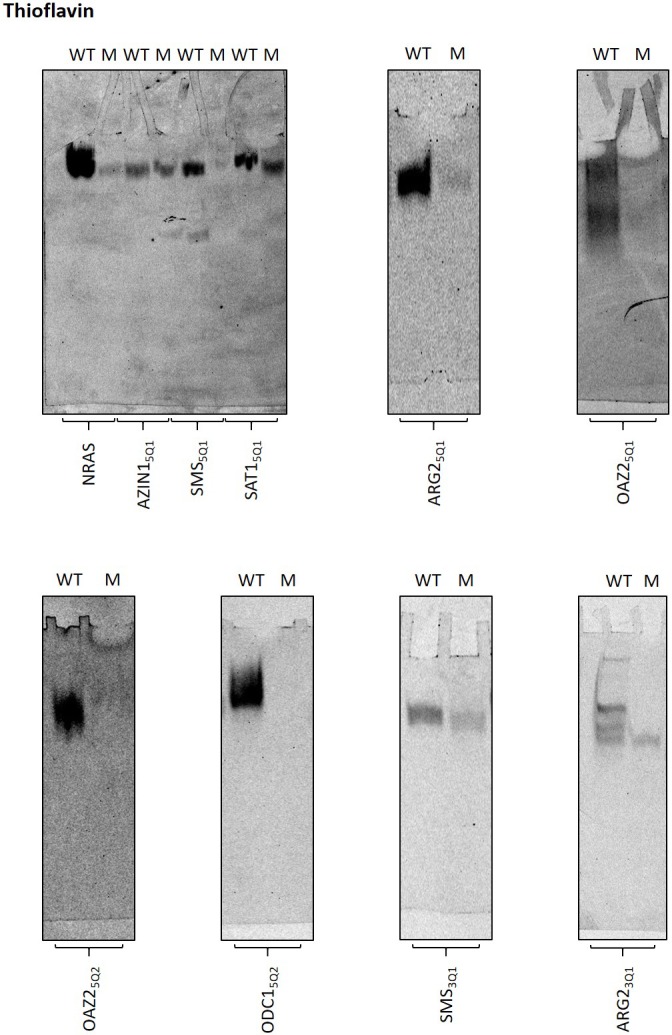
Figure 3. Biophysical properties of G2-PQSs from PSPs: Gel migration, Thioflavin T fluorescence, UV (295 nm), CD.
All biophysical studies were performed in 100 mM K+. PAGE migration and Thioflavin T staining were performed at different migration times on distinct gels. Melting temps (TM 295) are shown in the plots; a K+-effect (1 mM and 100 mM K+) on TM 295 was found for ARG25Q1 (+18.8°C), OAZ25Q2 (+20.9°C) and SMS5Q1 (+18.4°C); mutated controls ARG25Q1M, OAZ25Q1M, SMS5Q1M, AZIN15QM1, AZIN15QM2, AZIN15QM3, did not show any (TM 295) melting transitions (data not shown and Figure 3—figure supplement 1; Figure 5—figure supplement 3). CD measurements were not performed for ARG23Q1 due to the presence of multiple RNA species. Error bars represent the standard error (SE) from two independent replicates. (Gels in this figure were cropped: full length gels are in Figure 3—figure supplement 3 and 4.

Figure 3—figure supplement 1. UV melt-anneal profiles for mutant G2-PQS's.
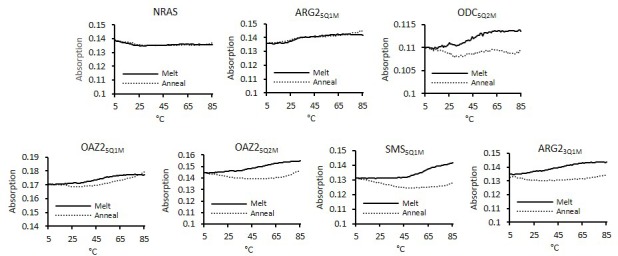
Figure 3—figure supplement 2. Additional biophysical data.
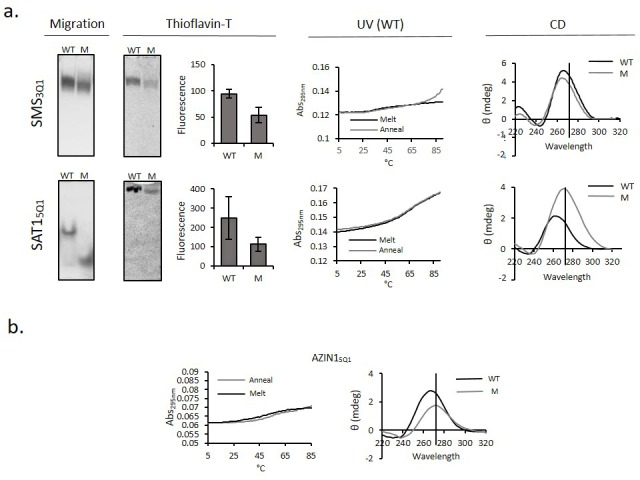
Figure 3—figure supplement 3. Full size migration gels from cropped images.
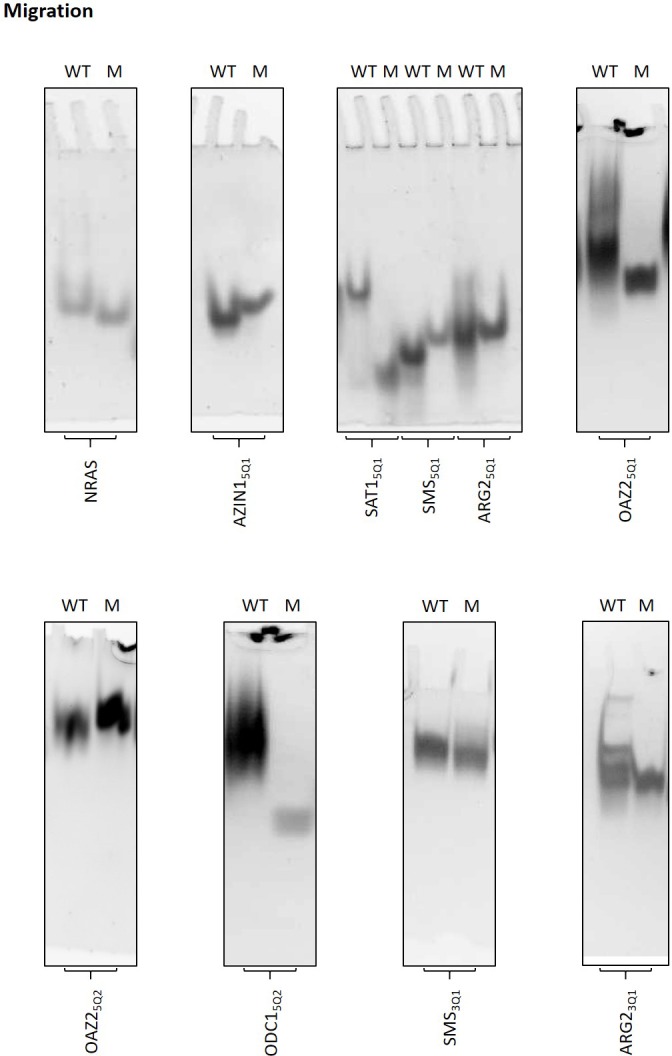
Figure 3—figure supplement 4. Full size thioflavin gels from cropped images.