
Figure 4. G2-PQS in PSPs form quadruplexes in Hela cells and self-regulate.
(a) Effects of pyridostatin (PDS) on spermine and spermidine (n=3, *p≤0.05, **p≤0.01). (b) Effects of PDS on endogenous SMS protein at 6 and 24 h (n=3, *p≤0.05, **p≤0.01) (full length blots are in Figure 4—figure supplement 4); effects on SMS5Q1 (n=3, *p≤0.05) and SMS3Q1 (n=3-5, **p≤0.01, ***p≤0.001) wild-type and mutant reporter gene expression (UT: untreated); (c) Effects of PDS on endogenous AZIN1 protein at 24 h (n=3, *p≤0.05) (full length blots are in Figure 4—figure supplement 4); effects on AZIN15Q1 wild-type and mutant reporter gene expression (n=6, *p≤0.05). (d) Effect of PA supplementation on reporter activity from PQS’s in HeLa cells (n=3, *p≤0.05, **p≤0.01). (e) Effect of DMFO and APCHA on levels of spermine and spermidine in HeLa cells. Two independent replicates were performed. (f) Effect of PQS’s from PSPs on reporter activity in HeLa cells under PA depletion (0.5 mM DFMO, 100 µM APCHA, 6 days) followed by PA rescue (0.5 mM DFMO, 100 µM APCHA, 6 days, 100 µM PA, addition day 5). (n=3-5, *p≤0.05). Error bars represent standard error (SE) from at least two independent replicates. See Figure 4—figure supplements 5, 6 and 7.

Figure 4—figure supplement 1. Cell viabilities after PDS treatments of HeLa cells.
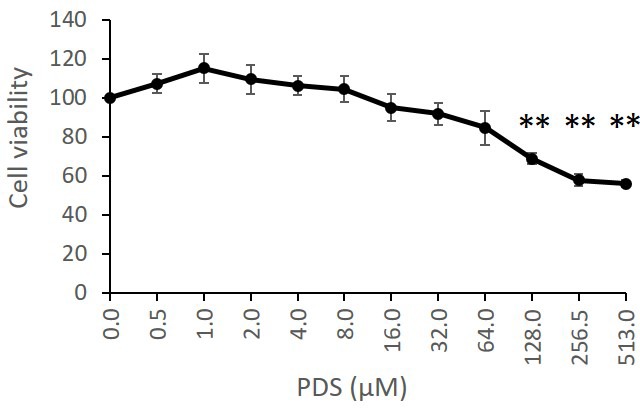
Figure 4—figure supplement 2. Effects of PDS treatment upon spermine and spermidine levels in HeLa cells.

Figure 4—figure supplement 3. Effects of PDS treatment on PQS reporter genes in HeLa cells: un-normalized data.

Figure 4—figure supplement 4. Effects of PDS treatment on endogenous polyamine synthesis proteins in HeLa cells.
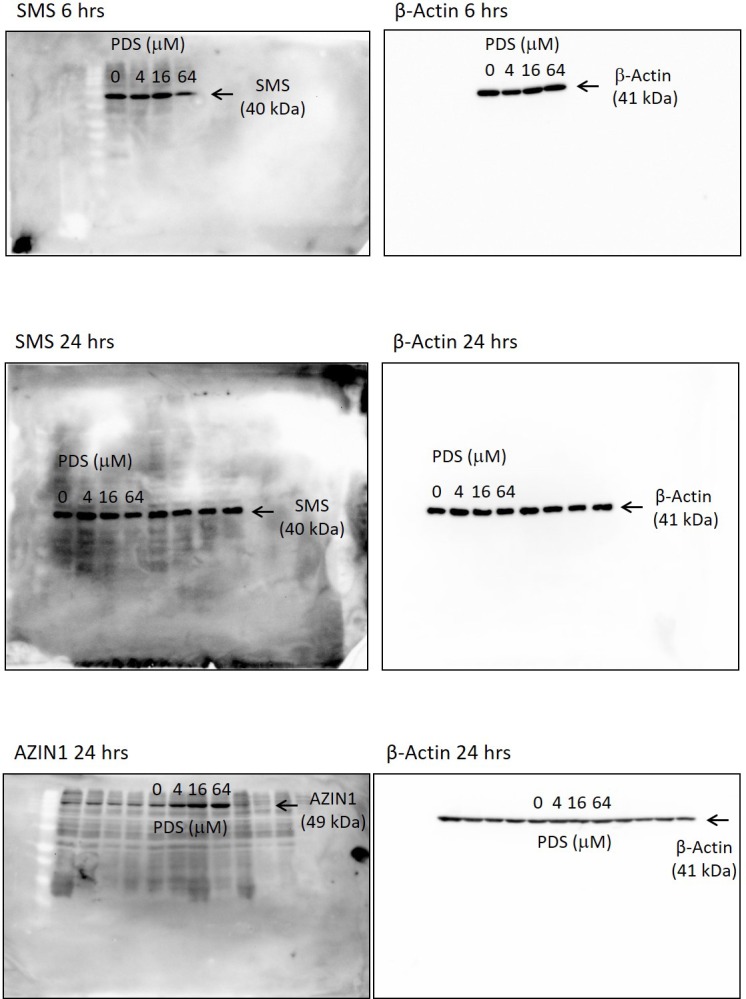
Figure 4—figure supplement 5. Polyamine addition and depletion reporter assays.

Figure 4—figure supplement 6. Polyamine addition and depletion reporter assays.
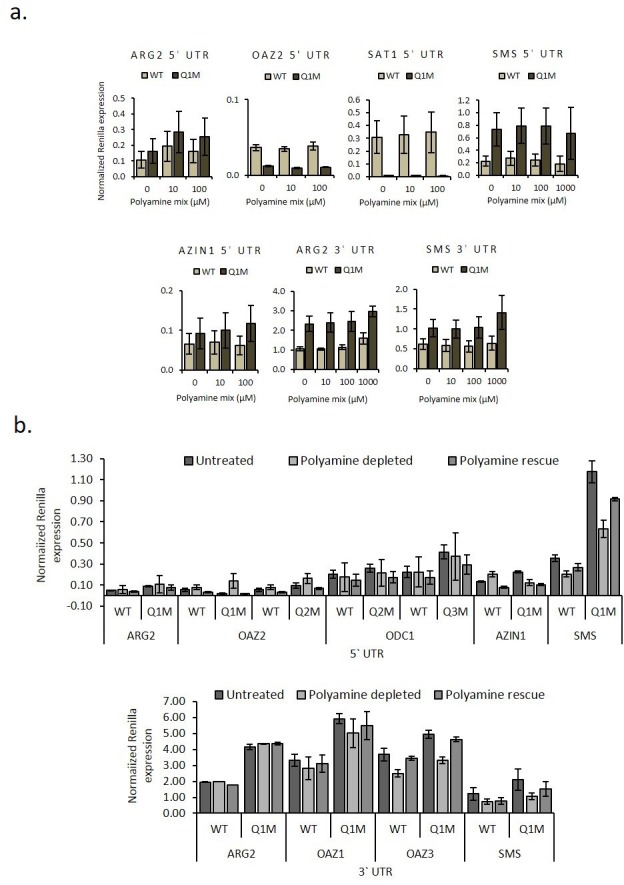
Figure 4—figure supplement 7. Polyamine depletion and spermine synthase inhibition.
