. 2018 Jul 31;7:e36362. doi: 10.7554/eLife.36362

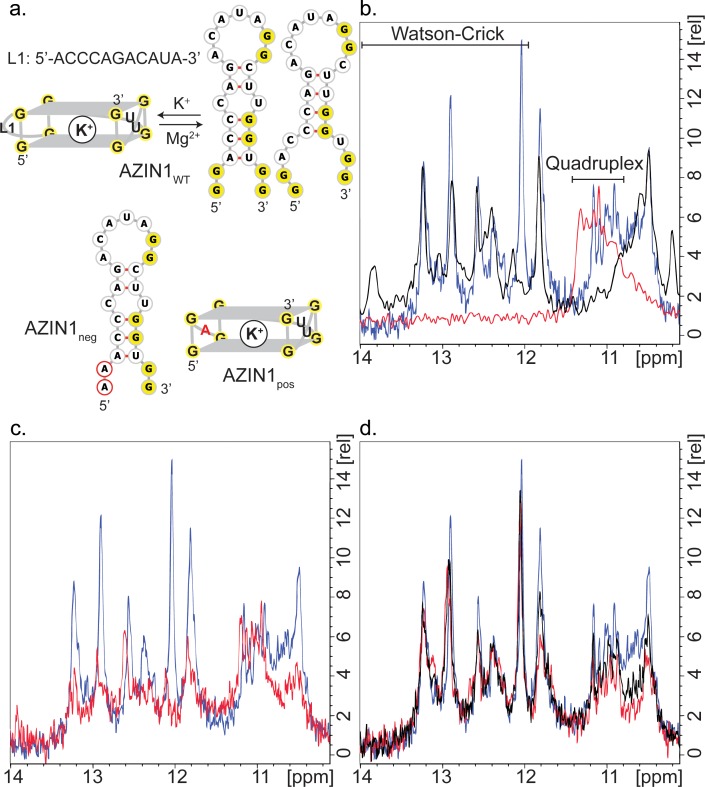
Figure 5. Structure of AZIN1wt.

(a) Derived model for the equilibrium between two possible hairpin conformers and the G2-quadruplex of AZIN1wt; K+ is expected to favor the G2-quadruplex; Na+ or Mg2+ are expected to favor the hairpin conformers, which are predicted by Mfold with free energies ΔG of −2.5 (left) and −1.8 kcal/mol (right). The mutants AZIN1neg and AZIN1pos were designed to stabilize the hairpin conformation and the G2-quadruplex, respectively: note the mutation of the first G2-tract at the 5’-end in AZIN1neg and the difference of the G2-quadruplex in the first loop from 5’-end (L1) for AZIN1pos. Sites of mutation are marked in red. (b) Overlay of 1H NMR spectra corresponding to the imino region of AZIN1wt (blue), AZIN1neg (black) and AZIN1pos (red) in 100 mM KCl (0.1 mM RNA). (c) Overlay of 1H NMR spectra corresponding to the imino region of AZINwt in 100 mM KCl (blue) and 200 mM KCl (red). (d) 1H NMR spectra after titration of spermine (Spm) to AZIN1wt in 100 mM KCl. Before addition of Spm (blue); after addition of Spm at RNA:Spm ratio of 1:1 (black) and 1:2 (red). Note the stronger decrease of the imino signals < 12 ppm.

Figure 5.

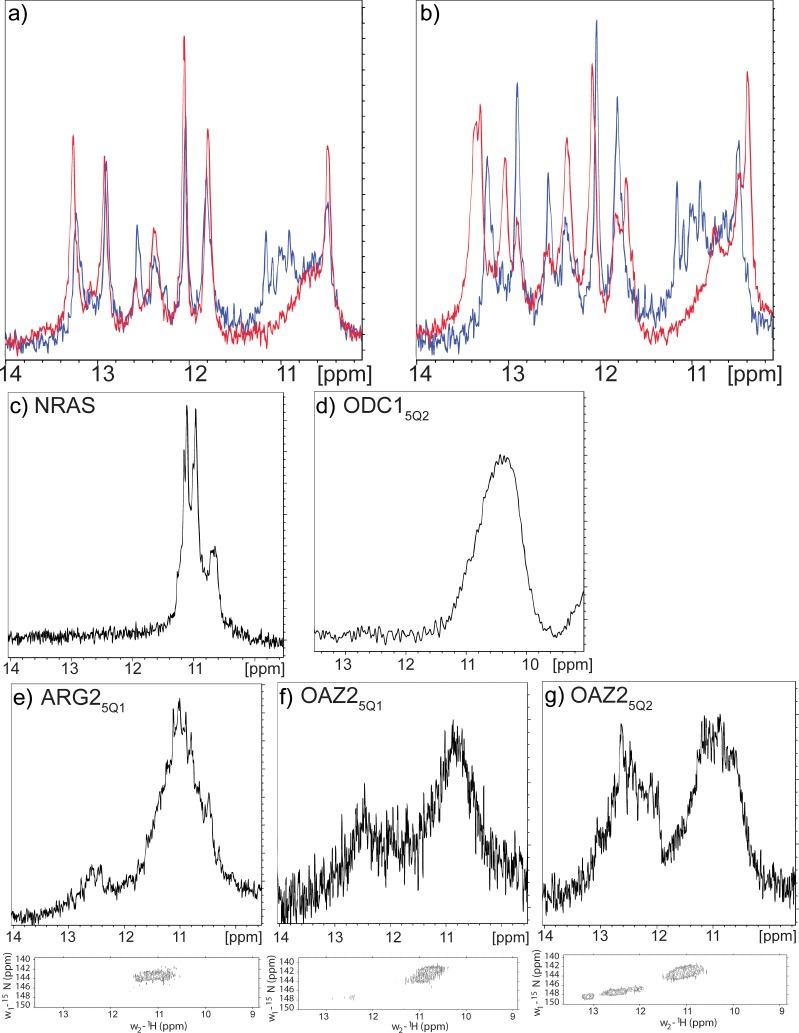
Figure 5—figure supplement 1. 1H NMR spectra of AZIN1wt, NRAS, ODC15Q2, ARG25Q1, OAZ25Q1 and OAZ25Q2.

Figure 5—figure supplement 1.

(a) Overlay of 1D 1H NMR spectra corresponding to the imino region of AZINwt in 100 mM KCl (blue) and 100 mM NaCl (red). (b) Overlay of 1D 1H NMR spectra corresponding to the imino region of AZINwt in 100 mM KCl (blue) and 2 mM MgCl2 (red). (c-d) 1D 1H NMR spectra corresponding to the imino region of NRAS and ODC15Q2 in 100 mM KCl. (e-g) 1D 1H NMR spectra and 1H-15N HSQC spectra corresponding to the imino region of ARG25Q1, OAZ25Q1 and OAZ25Q2 in 100 mM KCl. The imino protons observed at 11 ppm are bound to nitrogen atom with a chemical shift of about 145 ppm. The imino peaks at 12–13 ppm observed with OAZ25Q2 suggests that this RNA may form two alternative structures (G-quadruplex and a stem), similarly to what is observed with AZIN1wt. AZIN1pos: GGAGGCUUGGUGG; AZIN1neg: AAACCCAGACAUAGGCUUGGUGG; NRAS: GGGAGGGGCGGGUCUGGG; (0.03–0.5 mM RNA).
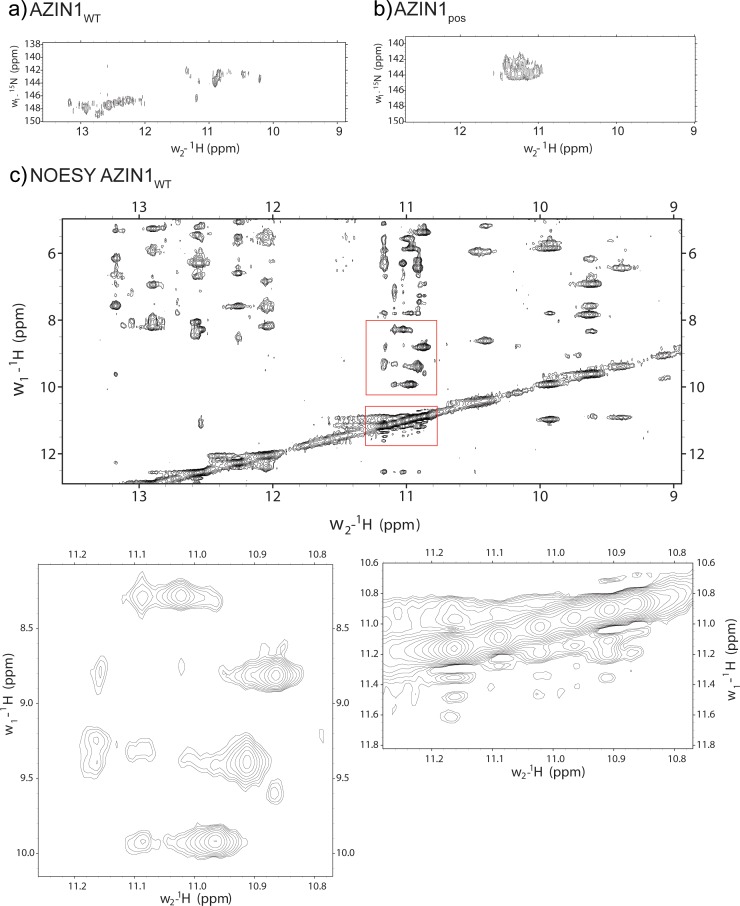
Figure 5—figure supplement 2. 1H 15N-HSQC and 1H 1H 2D NOESY of AZIN1wt.

Figure 5—figure supplement 2.

(a) 1H-15N-HSQC spectrum corresponding to the imino region of AZIN1wt (in the presence of 10% 15N-labelled RNA) in 200 mM KCl. (b1H-15N HSQC spectrum corresponding to the imino region of AZIN1pos in 100 mM KCl. (c) 1H 1H 2D NOESY spectrum of AZIN1wt in 100 mM KCl. Red frames indicate the expanded regions. (0.1–0.5 mM RNA).
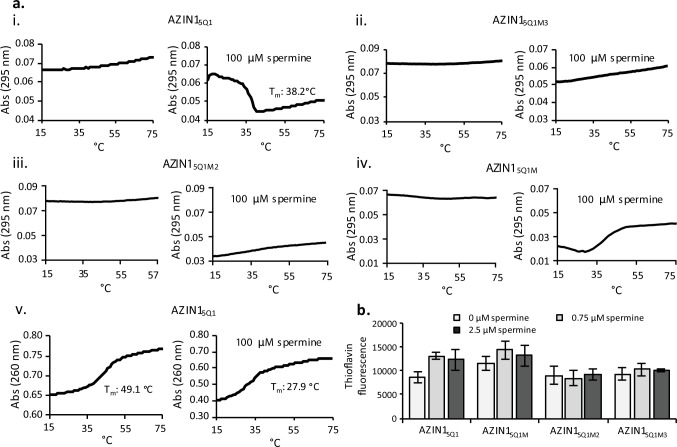
Figure 5—figure supplement 3. Polyamine-related biophysical analysis of AZIN15Q1.

Figure 5—figure supplement 3.

AZIN1 G2 quadruplex is induced by polyamines in vitro (a) Effect of spermine on UV melt profiles of (i) AZIN15Q1 (295 nm), (ii) control AZIN15Q1M3, (iii) control AZIN15Q1M2, (iv) control AZIN15Q1M (295 nm) and (v) AZIN15Q1 (260 nm) in the presence of 1 mM K+. Two replicates of each biophysical experiment were performed. (b) Effect of spermine for 1 hr on Thioflavin T fluorescence of AZIN15Q1, AZIN15Q1M, AZIN15Q1M2 and AZIN15Q1M3 in the presence of 1 mM K+ and 4.5 µM Thioflavin. The error bars represent the standard error (SE) from three independent replicates. AZIN15Q1M2: GGACCCAGACAUAGGCUUGGUAA; AZIN15Q1M3: AAACCCAGACAUAGGCUUGGUGG.