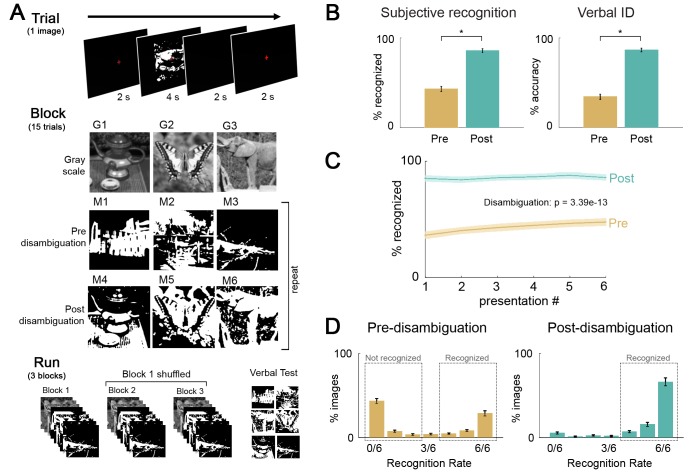
Figure 1. Paradigm and behavioral results.
(A) Task design, and flow of events at trial, block, and fMRI run level. Subjects viewed gray-scale and Mooney images and were instructed to respond to the question ‘Can you recognize and name the object in the image?”. Each block included three gray-scale images, three money images corresponding to these gray-scale images (i.e., post-disambiguation Mooney images), and three Mooney images unrelated to the gray-scale images (i.e. pre-disambiguation Mooney images, as their corresponding gray-scale images would be presented in the following block). 33 unique images were used and each was presented six times before and six times after disambiguation (see Materials and methods for details). (B) Left: Percentage of ‘recognized’ answers across all Mooney image presentations before and after disambiguation. These two percentages significantly differed from each other (p=3.4e-13). Right: Percentage of correctly identified Mooney images before and after disambiguation. These two percentages significantly differed from each other (p=1.7e-15). (C) Recognition rate for Mooney images sorted by presentation number, for the pre- and post-disambiguation period, respectively. A repeated-measures ANOVA revealed significant effects of the condition (p=3.4e-13), the presentation number (p=0.002), and the interaction of the two factors (p=0.001). (D) Distribution of recognition rate across 33 Mooney images pre- (left) and post- (right) disambiguation. Dashed boxes depict the cut-offs used to classify an image as recognized or not-recognized. All error bars denote s.e.m. across subjects.

