. 2018 Jul 31;7:e38801. doi: 10.7554/eLife.38801

Figure 1. Gain- and loss-of-function rap-2 mutants show synaptic tiling defects.

(A and B) Representative image of synaptic tiling of wild type (A) and plx-1 mutant (B) animals. Images show wyIs446 marker to label synapses in DA8 (GFP::RAB-3) and DA9 (GFP::RAB-3+mCherry::RAB-3). Dotted box represents the magnified images from A and B of the synaptic tiling border. Schematics of DA8 (green) and DA9 (magenta) neurons with parameters for analysis shown on the right. (C–F) Representative images of wyIs446 strains with the following genotypes: rap-2(G12V) overexpression in DA neurons (C), rap-2 G12V (miz18) (D), rap-2 null (gk11) (E) and rap-2 S17A (miz19) (F). Synaptic domains from DA8 and DA9 are highlighted with green and magenta lines, respectively. Asterisks: DA9 cell body. Arrows: dorsal commissure of DA9. Scale bars: 20 μm. (G) Quantification of overlap between DA8 and DA9 synaptic domains. Each dot represents a single animal. Blue bars indicate mean ± SEM. n.s.: not significant; ***p<0.001.

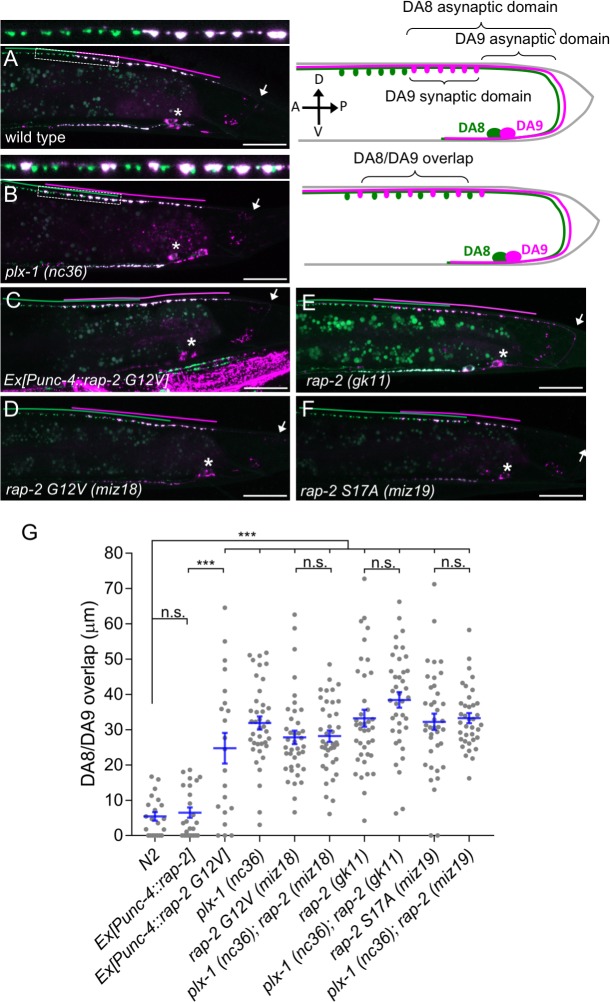
Figure 1.

Figure 1—figure supplement 1. rap-1 and rap-3 are not involved in synaptic tiling of DA8 and DA9.

Figure 1—figure supplement 1.

(A–C) Representative images of Prap-1::GFP (wyEx5445) (A), Prap-2::GFP (wyEx5464) (B) and Prap-3::GFP (mizEx194) (C). Merged images with DA markers shown on the right. (D) Representative image of synaptic tiling marker (wyIs446) in rap-1 mutants. (E) Representative image of synaptic tiling marker (wyIs524) in rap-3 mutants. wyIs524 shown given the linkage between wyIs446 and rap-3. Synaptic domains of DA8 and DA9 highlighted with green and magenta lines, respectively. Asterisks: DA9 cell body. Arrows: dorsal commissure of DA9. Scale bars: 20 μm. (F and G) Quantification of DA8/DA9 overlap. Blue bars indicate mean ± SEM. n.s.: not significant; ***p<0.001.

Figure 1—figure supplement 2. Synaptic tiling requires both GTP- and GDP-bound forms of RAP-2.

Figure 1—figure supplement 2.

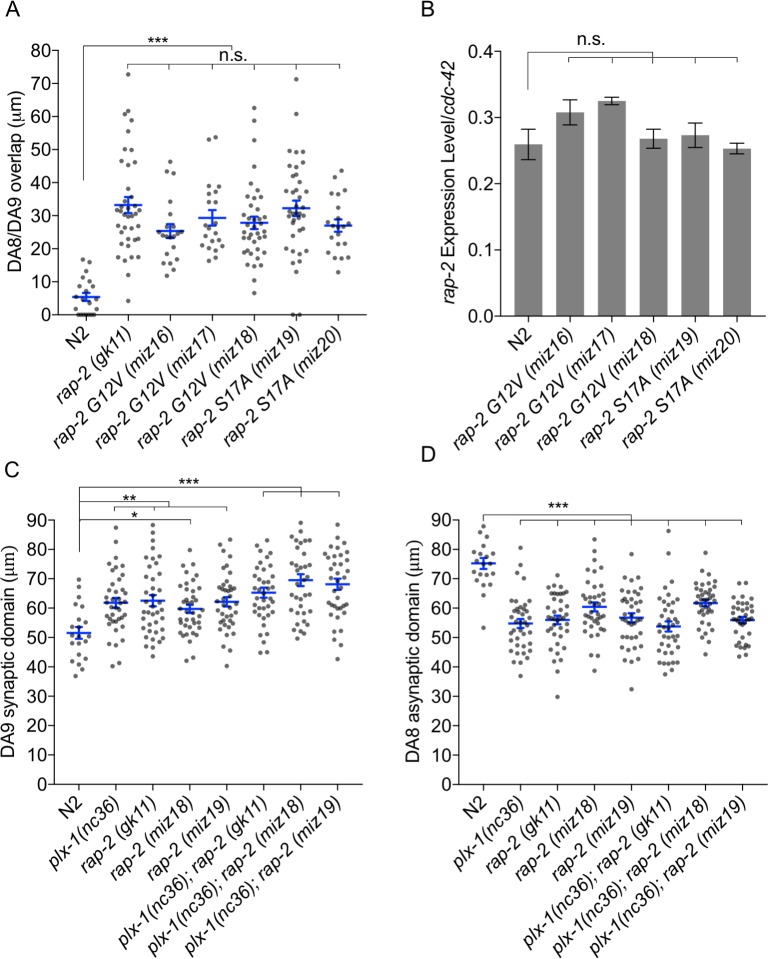
(A) Quantification of DA8/DA9 overlap. Blue bars indicate mean ± SEM. n.s.: not significant; **p<0.001. (B) RT-qPCR analysis of rap-2 CRISPR mutants. cdc-42 served as an internal reference. Average of 3 independent qPCR reactions are shown. Bars indicate mean ± SEM. n.s.: not significant. (C) Quantification of DA9 synaptic domain length. (D) Quantification of DA8 asynaptic domain length. Blue bars indicate mean ± SEM. n.s.: not significant; ***p<0.001; **p<0.01, *p<0.05.

Figure 1—figure supplement 3. Co-localization between RAB-3 and the active zone markers, CLA-1 and UNC-10.

Figure 1—figure supplement 3.

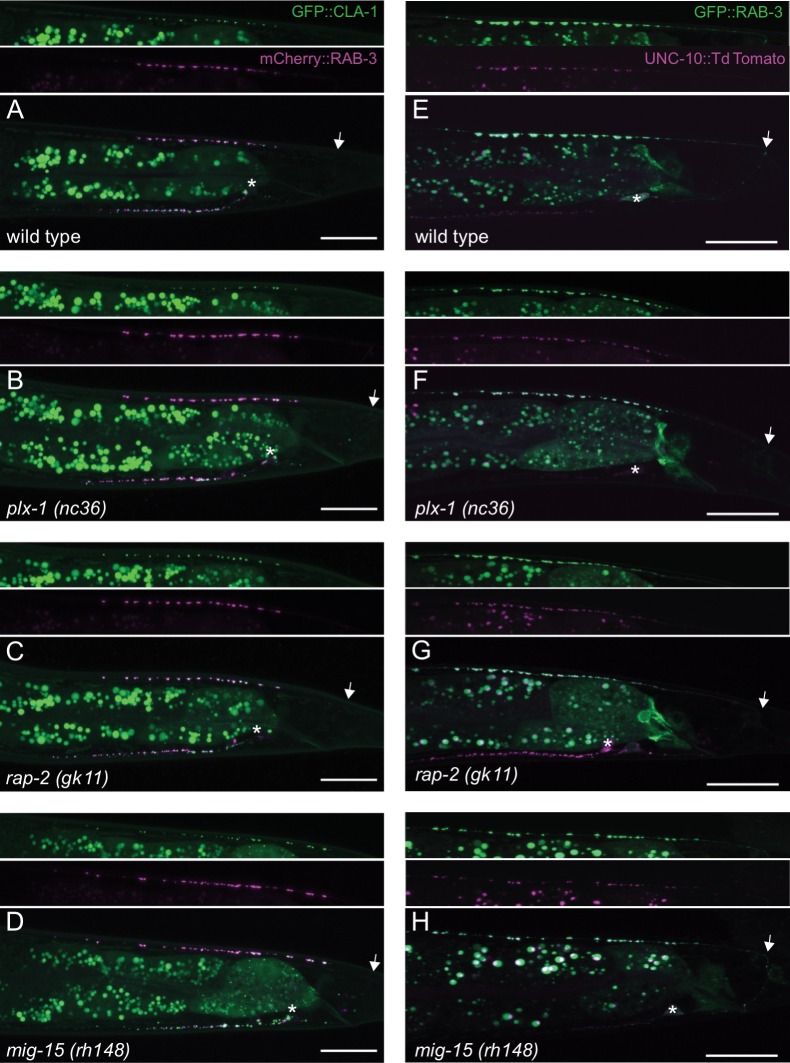
(A–D) Representative images of DA9 synaptic vesicle marker, mCherry::RAB-3, and active zone marker, CLA-1::3xGFPnovo2 (wyIs685) in wild type (A), plx-1 (B), rap-2 (C) and mig-15 (D). (E–H) Representative images of DA9 synaptic vesicle marker, GFP::RAB-3(wyIs85), and active zone marker, UNC-10::TdTomato (mizEx272) in wild type (E), plx-1 (F), rap-2 (G) and mig-15 (H). Arrows represent the position of DA9 commissure. Asterisks indicate DA9 cell body. Scale bars: 20 μm.