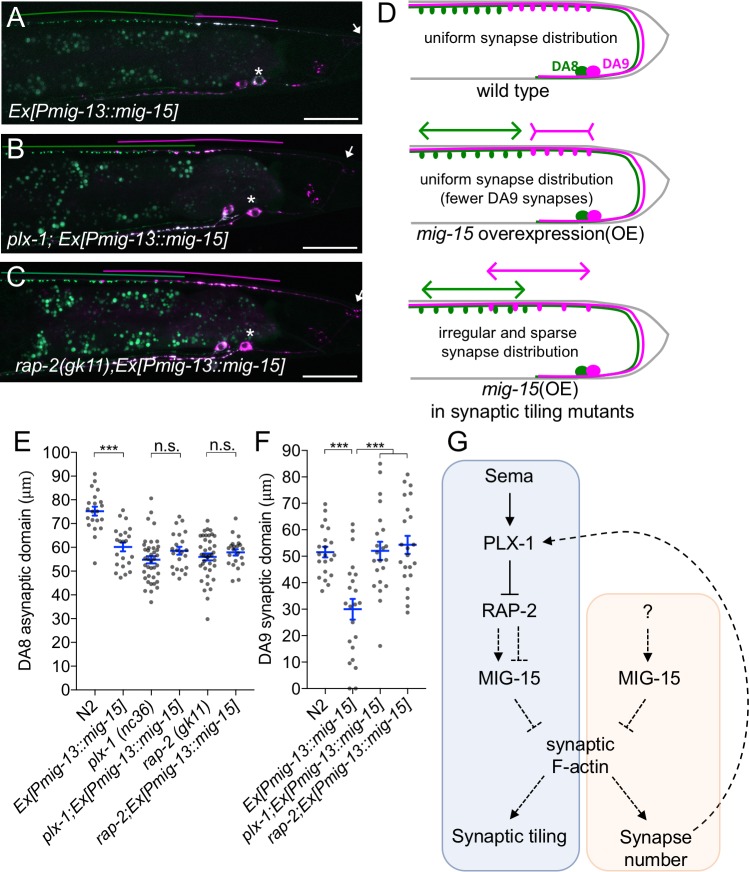
Figure 8. PLX-1/RAP-2 signaling coordinates synapse number and synaptic tiling border.
(A–C) Representative images of synaptic tiling marker (wyIs446) overexpressing mig-15 in DA9 from wild type (A), plx-1(nc36) (B) and rap-2(gk11) (C). Synaptic domains of DA8 and DA9 highlighted with green and magenta lines, respectively. Asterisks: DA9 cell body. Arrows: dorsal commissure of DA9. Scale bars: 20 μm. (D) Schematic illustration of synapse distribution in wild type (left), animals overexpressing mig-15 in DA9 (middle) and synaptic tiling mutants overexpressing mig-15 in DA9 (right). Arrows indicate the synaptic tiling border. Colored arrows represent expanded or shortened synaptic domain from DA8 (green) and DA9 (magenta). (E) Quantification of the DA8 asynaptic domain. (F) Quantification of the DA9 synaptic domain. Each dot represents measurements from a single animal. Blue bars indicate mean ± SEM. n.s.: not significant; ***p<0.001. (G) A model of synaptic tiling. PLX-1/RAP-2 signaling controls synaptic tiling via MIG-15, while MIG-15 also plays crucial roles in inhibiting the number of synapses. Solid lines indicate putative direct regulations, dotted lines represent indirect or unknown mode of regulations.

