. 2018 Jul 4;7:e38455. doi: 10.7554/eLife.38455

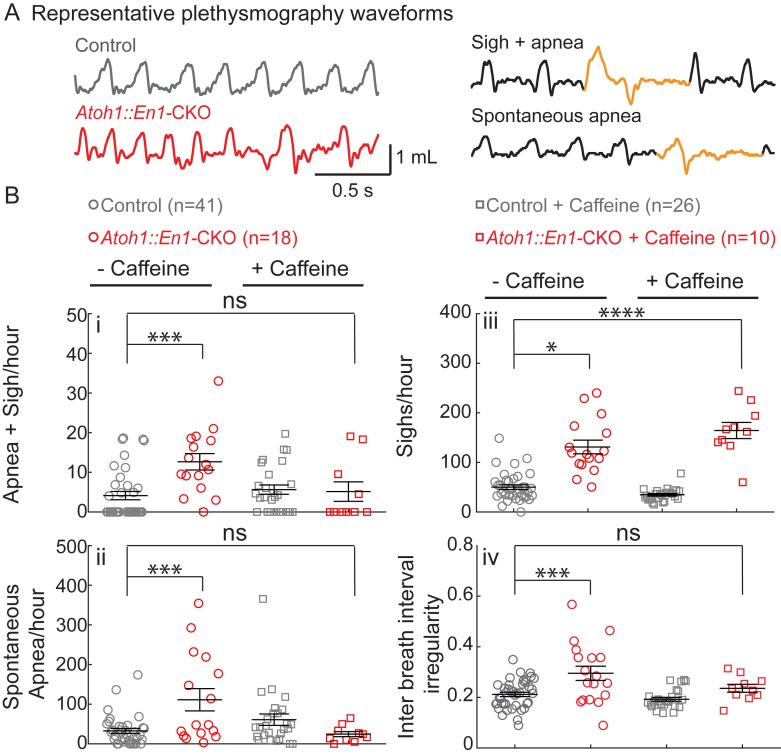
Figure 2. Atoh1::En1-CKO mice have many apneas causing irregular breathing rhythms that can be rescued by caffeine treatment in room air.

(A) Representative plethysmography traces from a control and Atoh1::En1-CKO mouse. Example traces of apnea and sigh. (Bi) Atoh1::En1-CKO mice have more apneas following sighs and (Bii) spontaneous apneas per hour than control littermates. Caffeine treatment rescues apneas. (Biii) Atoh1::En1-CKO mice have more sighs per hour than control littermates, which was not be rescued by caffeine. (Biv) Atoh1::En1-CKO mice breathe more irregularly than control littermates, which can be rescued with caffeine treatment. Inter breath interval irregularity was defined as: absolute (breath length(n + 1) – breath length(n)/breath length(n). Significance was determined using a Two-way ANOVA (genotype*treatment), Tukey-Kramer post-hoc. *p<0.05. **p<0.01. ***p<0.001. ****p<0.0001. Error bars represent: mean ± SEM.

Figure 2—source data 1. Raw plethysmography data room air recordings.
DOI: 10.7554/eLife.38455.008

Figure 2.

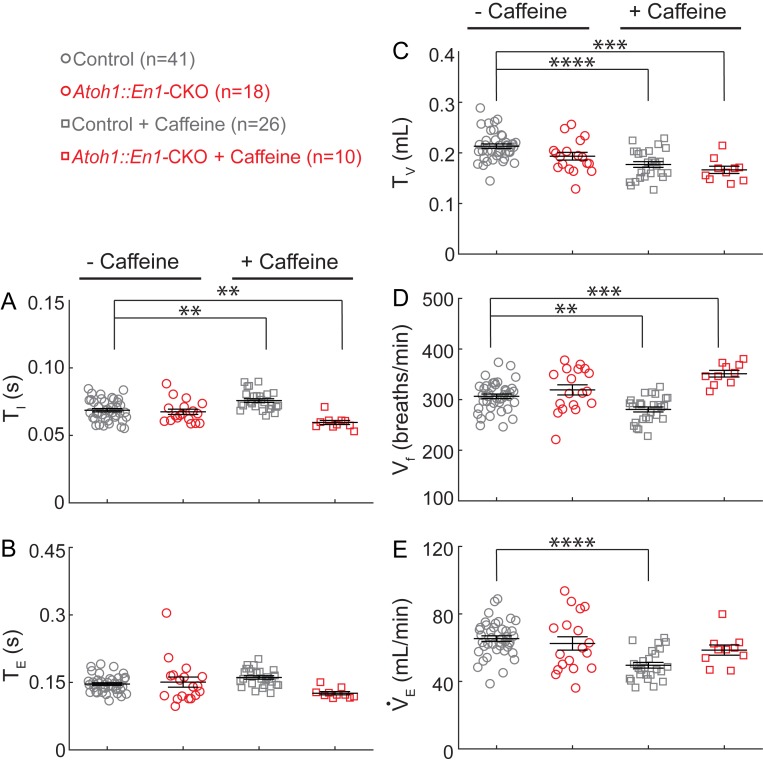
Figure 2—figure supplement 1. Caffeine treatment has opposing effects on changes in respiratory rhythms and tidal volume between Atoh1::En1-CKO mice and control littermates.

Figure 2—figure supplement 1.

There was no significant difference in (A) inspiration time (TI), (B) expiration time (TE), (C) Tidal volume (TV), (D) respiratory frequency (Vf), or (E) minute ventilation (VE) between Atoh1::En1-CKO mice and control littermates at baseline. Caffeine treatment caused a slight, but statistically significant, increase in TI (A) resulting in an increase in Vf in control mice (D), and, conversely, a decrease in TI (A) and increase in Vf in Atoh1::En1-CKO mice (D). Caffeine treatment also caused a decrease in TV in both control and Atoh1::En1-CKO mice (C), resulting in a decrease in VE in control mice but not in Atoh1::En1-CKO mice (E) due to the observed increase in Vf (D). Significance was determined using a Two-way ANOVA (genotype*treatment), Tukey-Kramer post-hoc. *p<0.05. **p<0.01. ***p<0.001. ****p<0.0001. Error bars represent mean ± SEM.