. 2018 Jul 4;7:e38455. doi: 10.7554/eLife.38455

Figure 3. Atoh1::En1-CKO mice have abnormal respiratory chemoresponses that cannot be rescued by caffeine.

Normalized changes in tidal volume (TV) (A), respiratory frequency (Vf) (B), and minute ventilation (VE) (C and D) during hypoxic challenge (10% O2, balanced N2). Atoh1::En1-CKO mice show respiratory repression during hypoxia (B) that cannot be rescued by caffeine (D). Normalized changes in TV (E), Vf (F), and VE (G and H) during hypercapnic chemochallenge (5% CO2, 21% O2, balanced N2). Atoh1::En1-CKO mice have attenuated response to hypercapnia (E and F) that cannot be rescued by caffeine (H). Significance was determined using a t-test (2-tailed) at each individual time point, *p<0.0011 (0.05/44 for Bonferroni correction). Error bars represent mean ± SEM.

Figure 3—source data 1. Raw plethysmography data respiratory chemoresponses.
DOI: 10.7554/eLife.38455.012

Figure 3.

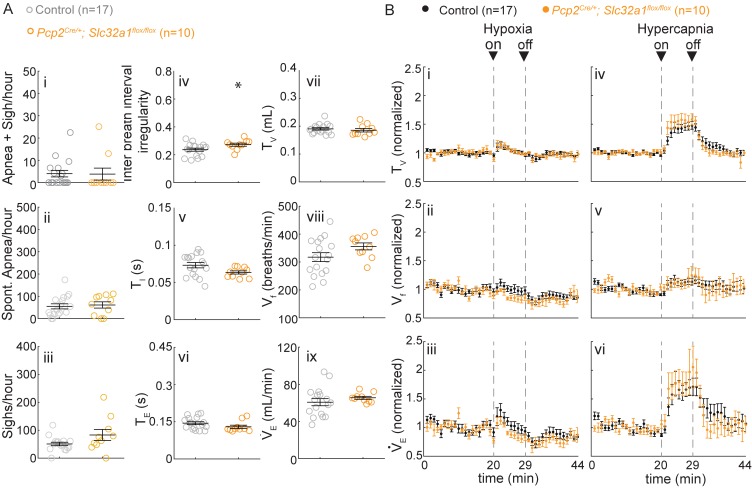
Figure 3—figure supplement 1. Silencing cerebellar cortex output neurons does not cause abnormal respiratory control.

Figure 3—figure supplement 1.

(A) Mice with silenced Purkinje cells (Pcp2Cre/+;Slc32a1Flox/Flox) have slightly more irregular breathing rhythms (iii), but otherwise normal respiratory rhythms in room air. Significance for room air breathing parameters were determine using a t-test (2-tailed). *p<0.05. (B) Pcp2Cre/+;Slc32a1Flox/Flox have normal respiratory chemoresponses to hypoxia and hypercapnia. Significance was determined using a t-test (2-tailed) at each individual time point, *p<0.0011 (0.05/44 for Bonferroni correction). Error bars represent mean ± SEM.
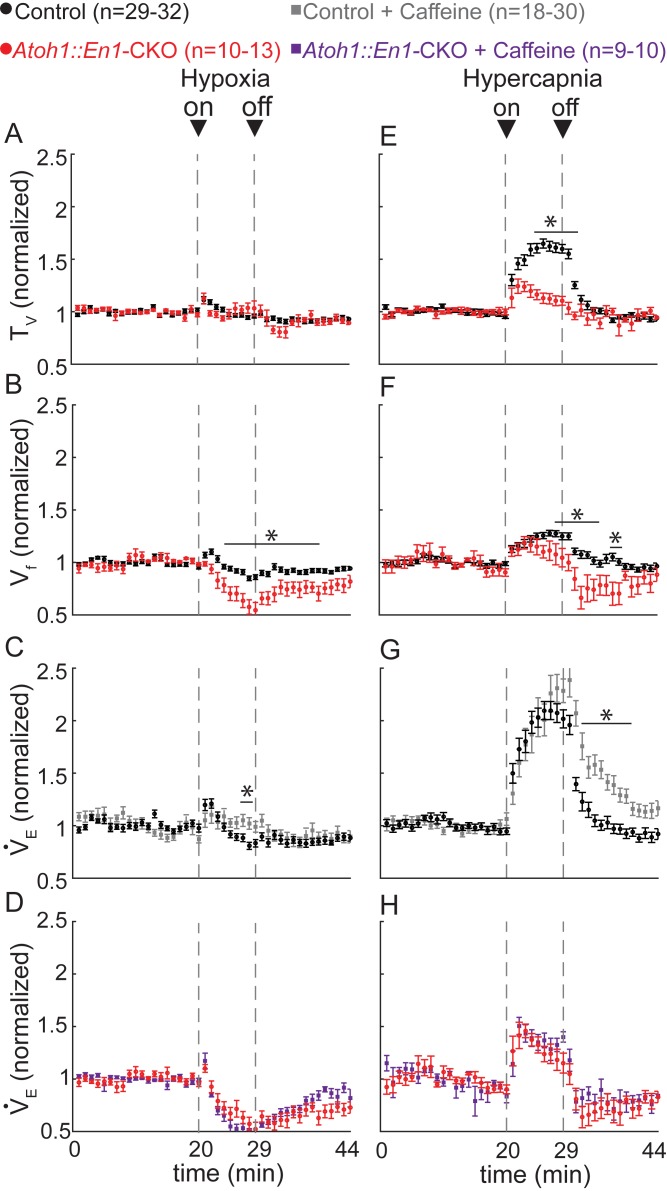
Figure 3—figure supplement 1—source data 1. Raw plethysmography data respiratory chemoresponses.
DOI: 10.7554/eLife.38455.011