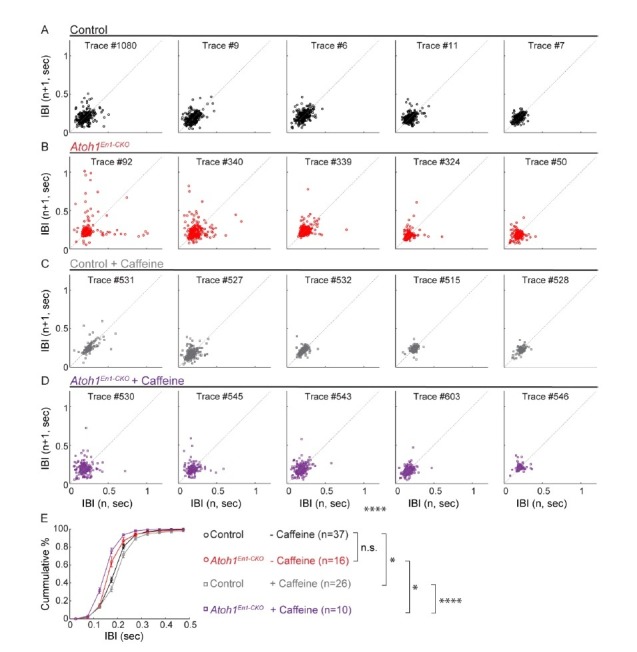
Author response image 1. Caffeine had opposing effects on respiratory frequency distributions in Atoh1En1-CKOmice and control littermates.

(A-D) Poincaré plots of breathing frequency of subsequent breaths plotted as the inter breath interval against subsequent breaths (n vs. n+1). Each plot represents the first 250 recorded breaths of five randomly selected animals from each group. Points that fall far away and a wider distribution from the dotted diagonal represent breaths that are more irregular. Breaths with an IBI larger than 0.5 seconds are possibly apnea. For each group, the plots were ordered from most irregular breathing to most regular breathing animals to ease visual comparison. (E) Cumulative frequency distribution curves Atoh1En1-CKOand control mice treated with or without caffeine. Untreated control and Atoh1En1-CKO mice had similar frequency distributions. The frequency distribution curve for control mice was right-shifted, representing longer IBIs and possibly calmer mice. The frequency distribution curve for Atoh1En1-CKO mice was left-shifted, representing shorter IBIs and potentially less calm mice. Significance was determined using a two-way repeated measure ANOVA. *p<.05. **p<.01. ***p<0.001. ****p<.0001. Error bars represent mean ± SEM.
