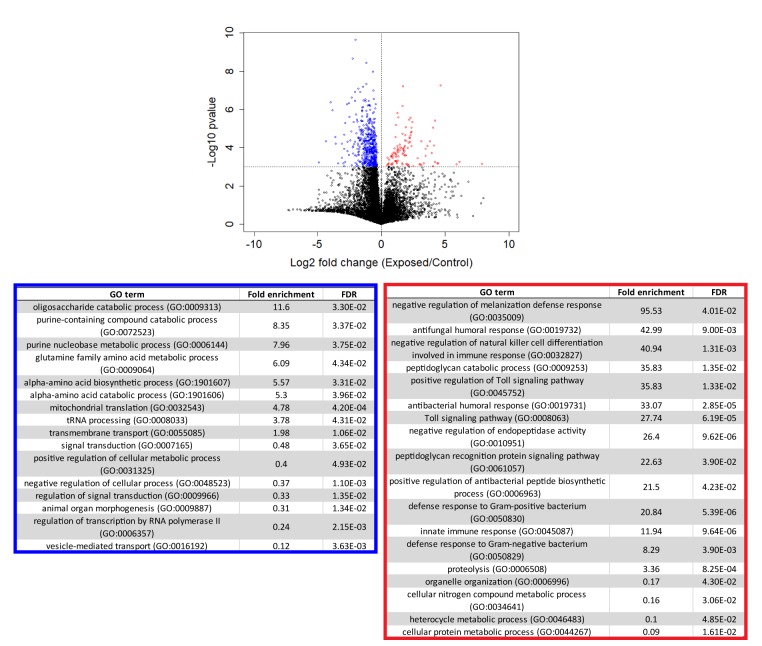
Figure 5. Genes that are consistently over or under-expressed compared to controls over the first 96 hr after exposure to E. muscae 'Berkeley'.
Top: Volcano plot for all genes over the first 96 hr after exposure. P-value is determined by ANOVA grouping 24–96 hr control vs. 24–96 hr exposed samples. Genes with p-value below 0.001 are shown in color. Bottom: PANTHER Gene Ontology (GO)-term analysis (complete biological process) of genes overexpressed (red) or under-expressed (blue) in exposed animals compared to controls. FDR column lists the p-value from a Fisher’s Exact test with false discovery rate correction for multiple testing.

