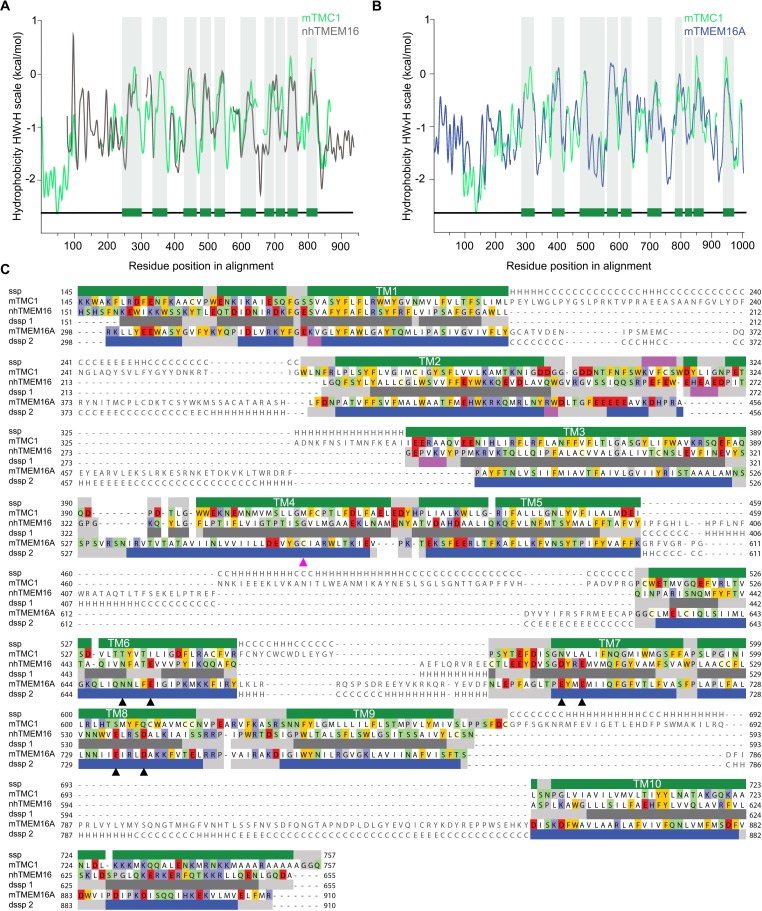
Figure 1. TMC1 and TMEM16 proteins share a common fold.
(A) Hydrophobicity profiles for nhTMEM16 (gray) and mTMC1 (green) revealing conserved hydrophobic regions. Residues corresponding to mTMC1 TM helices are indicated with green bars and gray shading. (B) Hydrophobicity profiles for mTMEM16A (blue) and mTMC1 (green) revealing conserved hydrophobic regions. TM regions are indicated as in (A). (C) mTMC1, nhTMEM16 and mTMEM16A sequence alignment used to generate TMC1 models. Non-modeled residues are shown in gray without highlighting, while residues shown in the model are highlighted according to their properties; neutral in white, aromatic in yellow, polar in green, basic in blue and acidic in red. TMC1 secondary structure prediction (ssp) is shown at the top of the alignment and secondary structure information extracted from nhTMEM16 and mTMEM116A structures (dssp1 and dssp2, respectively) is included below the corresponding sequences. Grey rectangles indicate loops, pink rectangles β-strands, and α−helices are shown as green rectangles for TMC1, grey for nhTMEM16 and blue for mTMEM16A. Conserved TM helices are labeled and the six residues involved in calcium binding found in TMEM16 and absent in TMC proteins, are indicated with black arrowheads. The magenta arrowhead indicates the position of the Beethoven mutation in TMC1.


