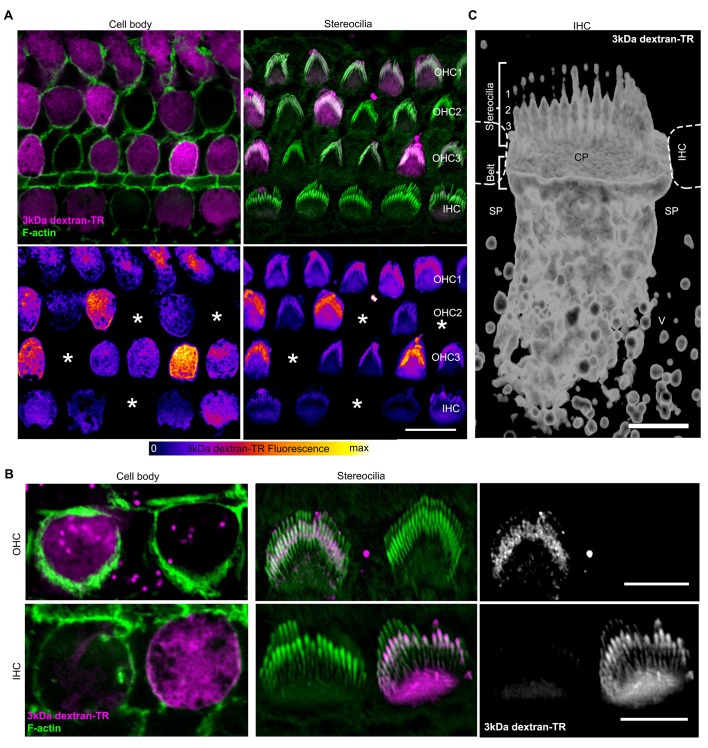
Figure 6. Stereocilia labeling in hair cells taking up 3 kDa dextran-TR.
(A) Confocal images displaying 3 kDa dextran-TR fluorescence (magenta in top panels) at the cell body and stereocilia counterstained with phalloidin to label F-actin (green) and thereby visualize hair cell boundaries and stereocilia. 3 kDa dextran-TR fluorescence from the same confocal images is shown below represented with the fire-LUT scale, which displays the amount of 3 kDa dextran-TR fluorescence in different colors (low in blue, medium in red and high in yellow). Cells lacking 3 kDa dextran-TR fluorescence at the cell body and stereocilia are indicated with an asterisk. Scale bar represents 20 μm. (B) Closer view of 3 kDa dextran-TR fluorescence at the cell body and stereocilia of outer hair cells (OHC) and inner hair cells (IHC). Scale bar represents 5 μm. (C) 3-D volume reconstruction of the 3 kDa dextran-TR fluorescence detected in a z-series image of the apical region of an IHC . Hair cells rows are numbered. Neighboring IHC, cuticular plate (CP) and supporting cells (SP) vesicles (V) are also indicated. Scale bar represents 2 μm.

